
|
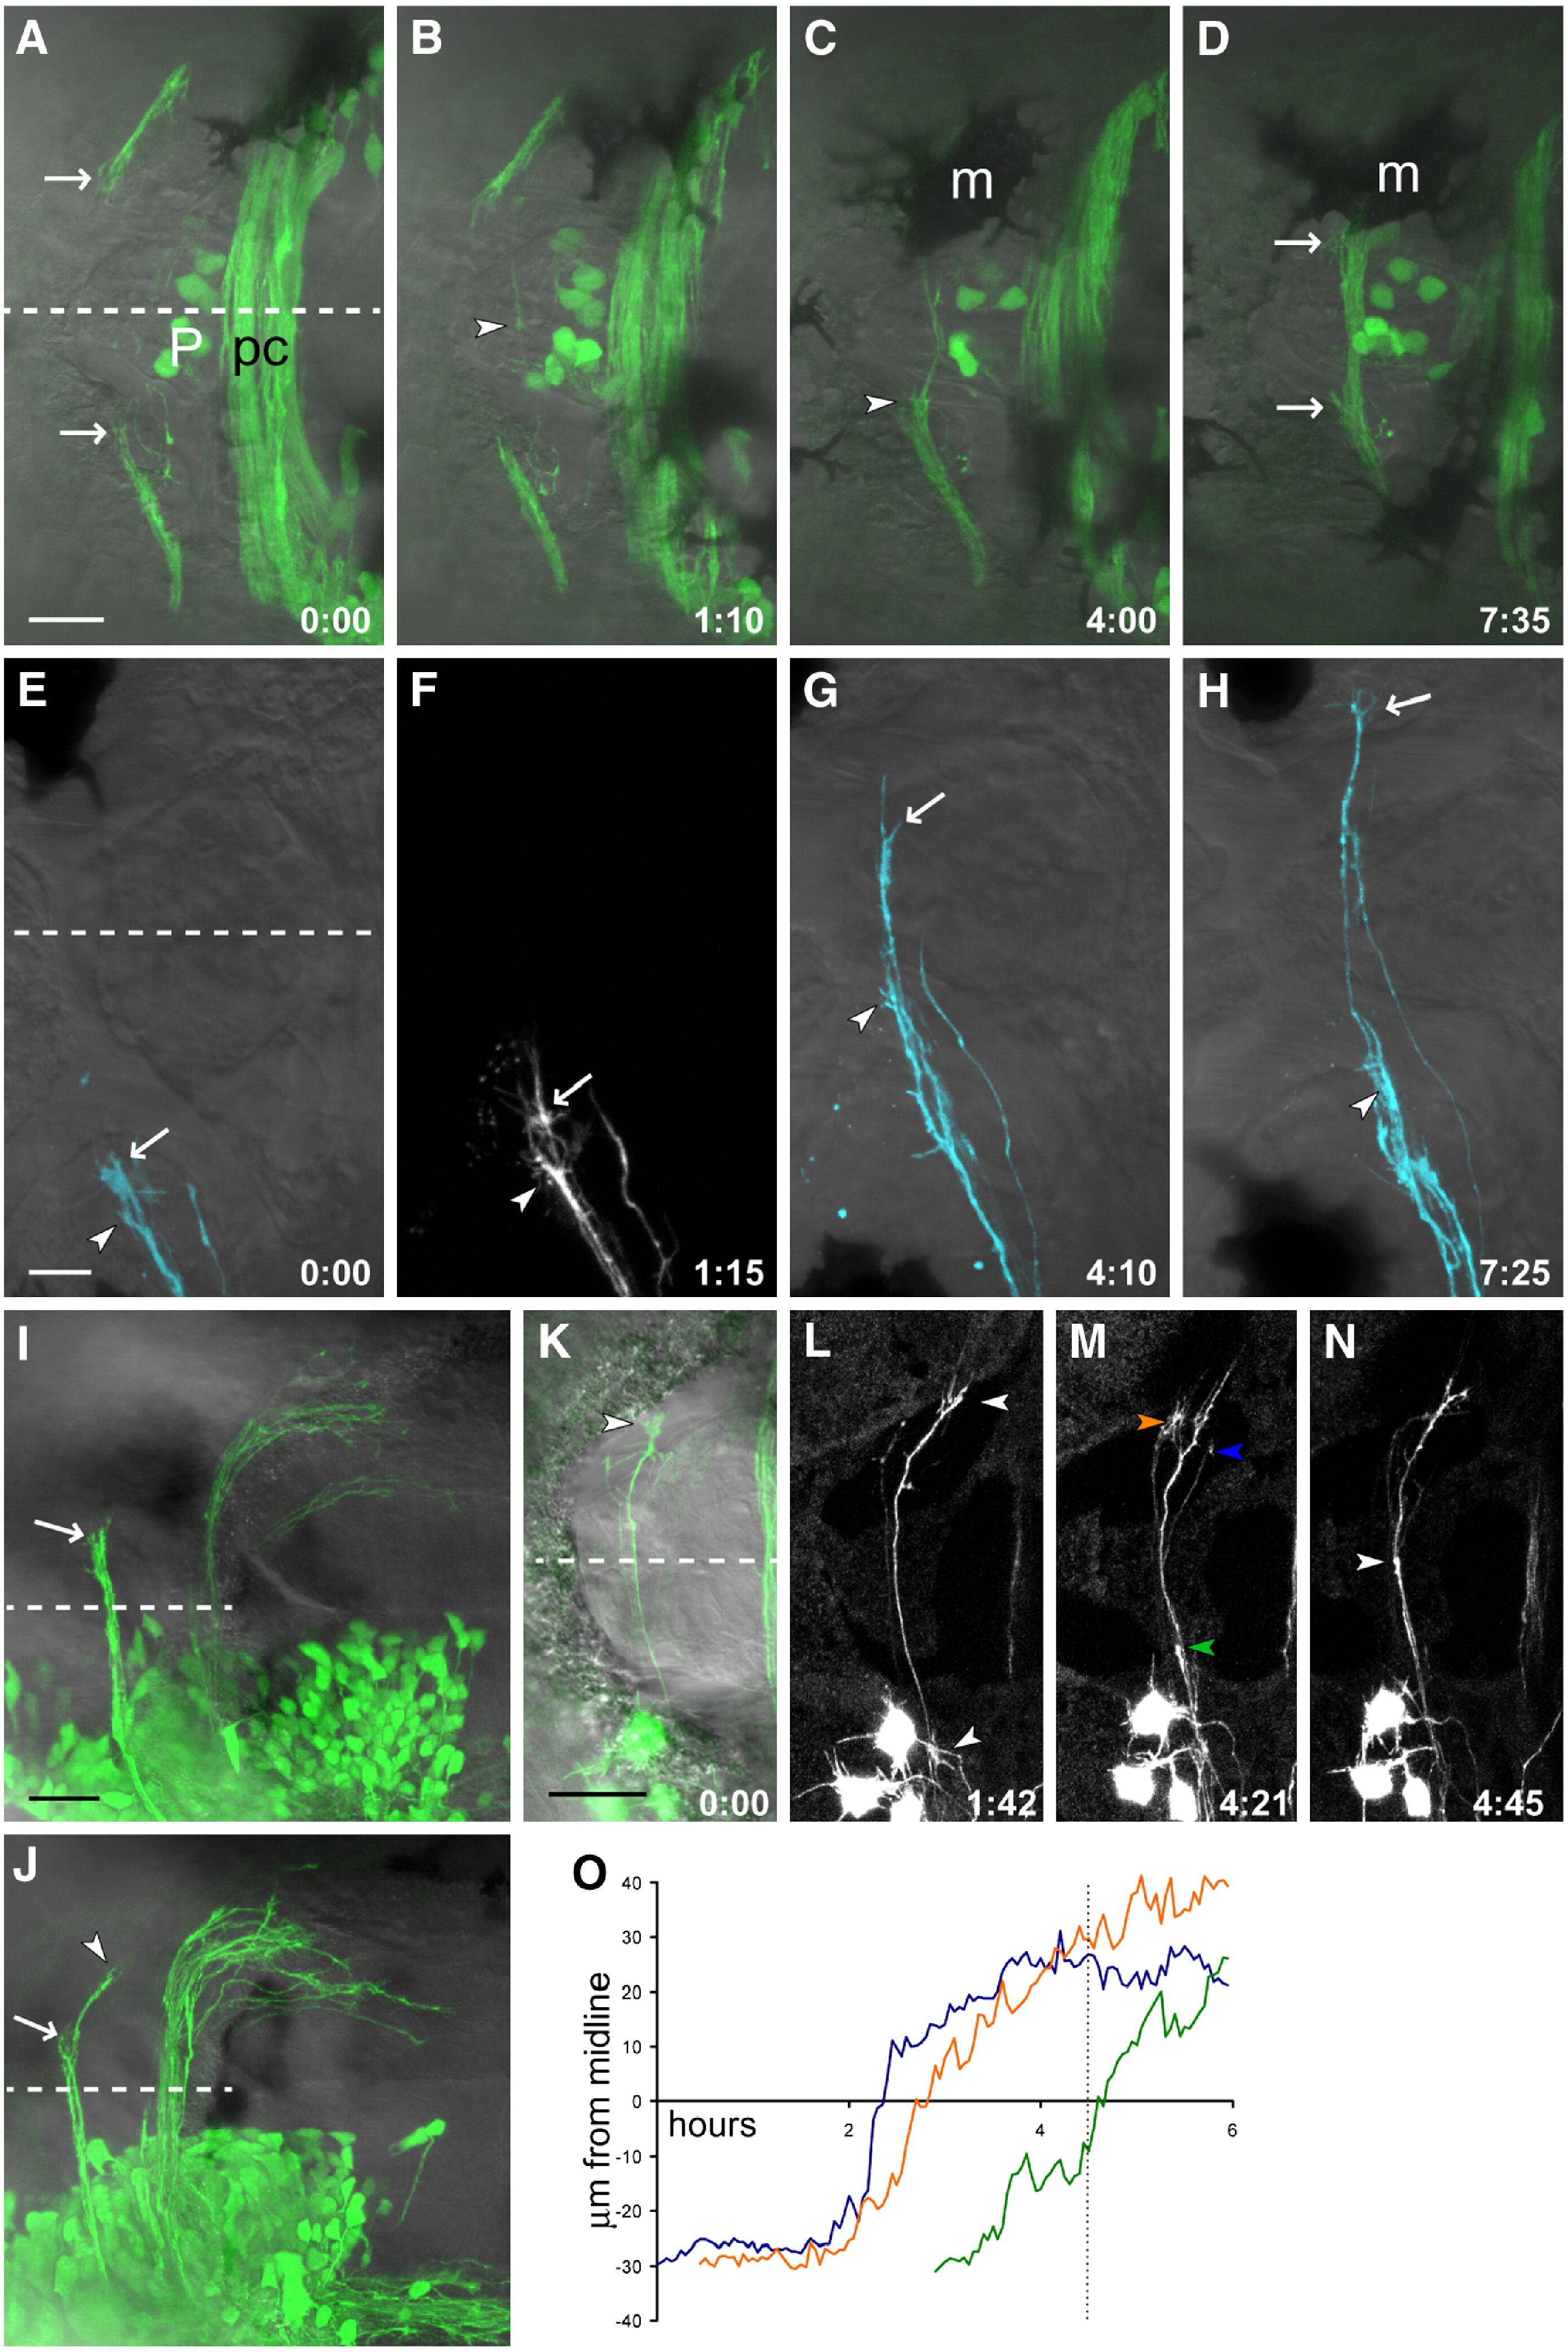
Fig. 1 Habenular commissural axons pause before and after crossing. (A–D) Time series of HC development in the Kaede line (see Supplementary Movie 1). (A) Commissural axons enter the habenulae as a bundle but splay out near the medial boundary of the habenula (arrows). (B) A single pioneer axon crosses (arrowhead) while other axons remain outside the roof plate. (C) As several more axons cross the midline, the bundle within the habenulae thickens, and more axons accumulate at the medial boundary. This is visible here in the left habenula (arrowhead); the right habenula is obscured by a melanophore (m). (D) As the commissure thickens, axons tips are still visible outside the roof plate (arrows). (E–H) A 2-day-old embryo, in which a subset of HC axons from the left EmT have been labeled with the lipophilic tracer DiD. (E, F) Several axons prior to crossing, with their tips within the left habenula. Two large growth cones extending multiple filopodia can be seen (arrowhead and arrow). (G) One axon has begun crossing ahead of the others (arrow), while the growth cone indicated with an arrowhead remains ipsilateral. (H) The first axon (arrow) has reached the contralateral habenula and shows a more complex morphology than during crossing, a second axon has almost finished traversing the roof plate, the third axon (arrowhead) has still not crossed. (I) An embryo unilaterally electroporated with HuC:Gal4/UAS:EGFP with commissural axons in a bundle which has reached the contralateral habenula boundary (arrow). (J) In another embryo at a slightly later stage, a few axons have entered the contralateral habenula (arrowhead) while others remain outside the roof plate (arrow). (K–N) A time series of a 2 dpf EGFP-electroporated embryo shows axons pausing ipsi- and contralaterally, but fasciculated and rapidly extending within the roof plate (N, see Supplementary Movie 2). Three growth cones indicated in panel M were tracked over time and their distance from the midline plotted (O, arrowhead color corresponds to line color). The axons extend most rapidly around the midline; dotted line in (O) indicates the time point shown in (M). Dashed line indicates the midline. Time is h:min. Scale bars = 20 μm (A–D), 10 μm (E–H), and 25 μm (I–N). Anterior to the left. m, melanophore; P, pineal organ; pc, posterior commissure.
Reprinted from Molecular and cellular neurosciences, 37(2), Hendricks, M., Mathuru, A.S., Wang, H., Silander, O., Kee, M.Z., and Jesuthasan, S., Disruption of Esrom and Ryk identifies the roof plate boundary as an intermediate target for commissure formation, 271-283, Copyright (2008) with permission from Elsevier. Full text @ Mol. Cell Neurosci.