
Fig. 4
|
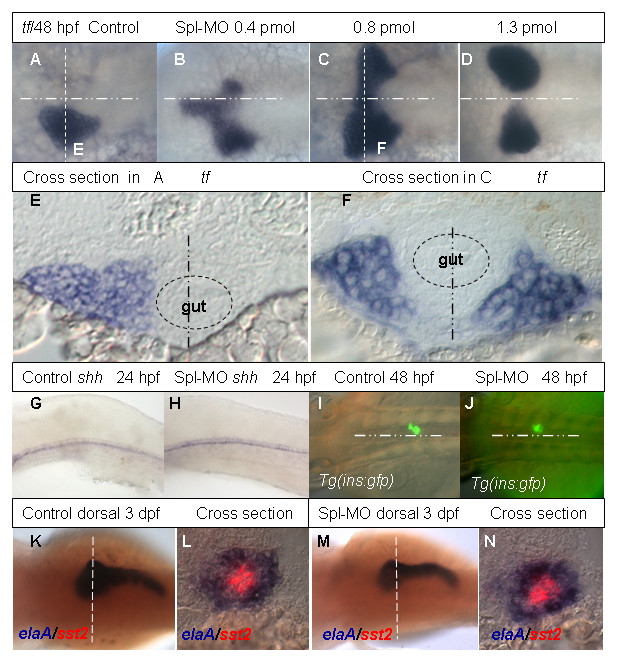
Fig. 4 Analyses of liver and pancreas development in Rbp4 morphants. (A-D) Dorsal view of transferrin expression at 48 hpf in a control embryo (A) and in 48 hpf embryos injected with increasing dosage of Spl MO as indicated (B-D). The midline is indicated by a horizontal point/dash line. (E, F) Cross sections of the control embryo in (A) and morphant in (C) respectively. The section plane is indicated in (A, C) by the vertical dash line. Dashed circles in (E, F) represent gut and the vertical poin/dash lines indicate the midline. (G, H) Lateral view of shh expression in 24 hpf control embryo (G) and morphant (H). (I, J) Dorsal view of GFP expression in the principle islet of pancreas in 48 hpf control Tg(ins:gfp) embryo (I) and morphant (J). (K-N) Control and morphant stained using two-color WISH with fluorescein-labeled somatostatin 2(red) and Dig-labeled elaA (blue). Panels (K, M) shows dorsal views of 3 dpf control and morphant respectively. Panels (L, N) are cross section at the planes as indicated in (K, M). Abbreviations: elaA, elastaseA; sst2, somatostatin 2; shh, sonic hedgehog; tf, transferrin.