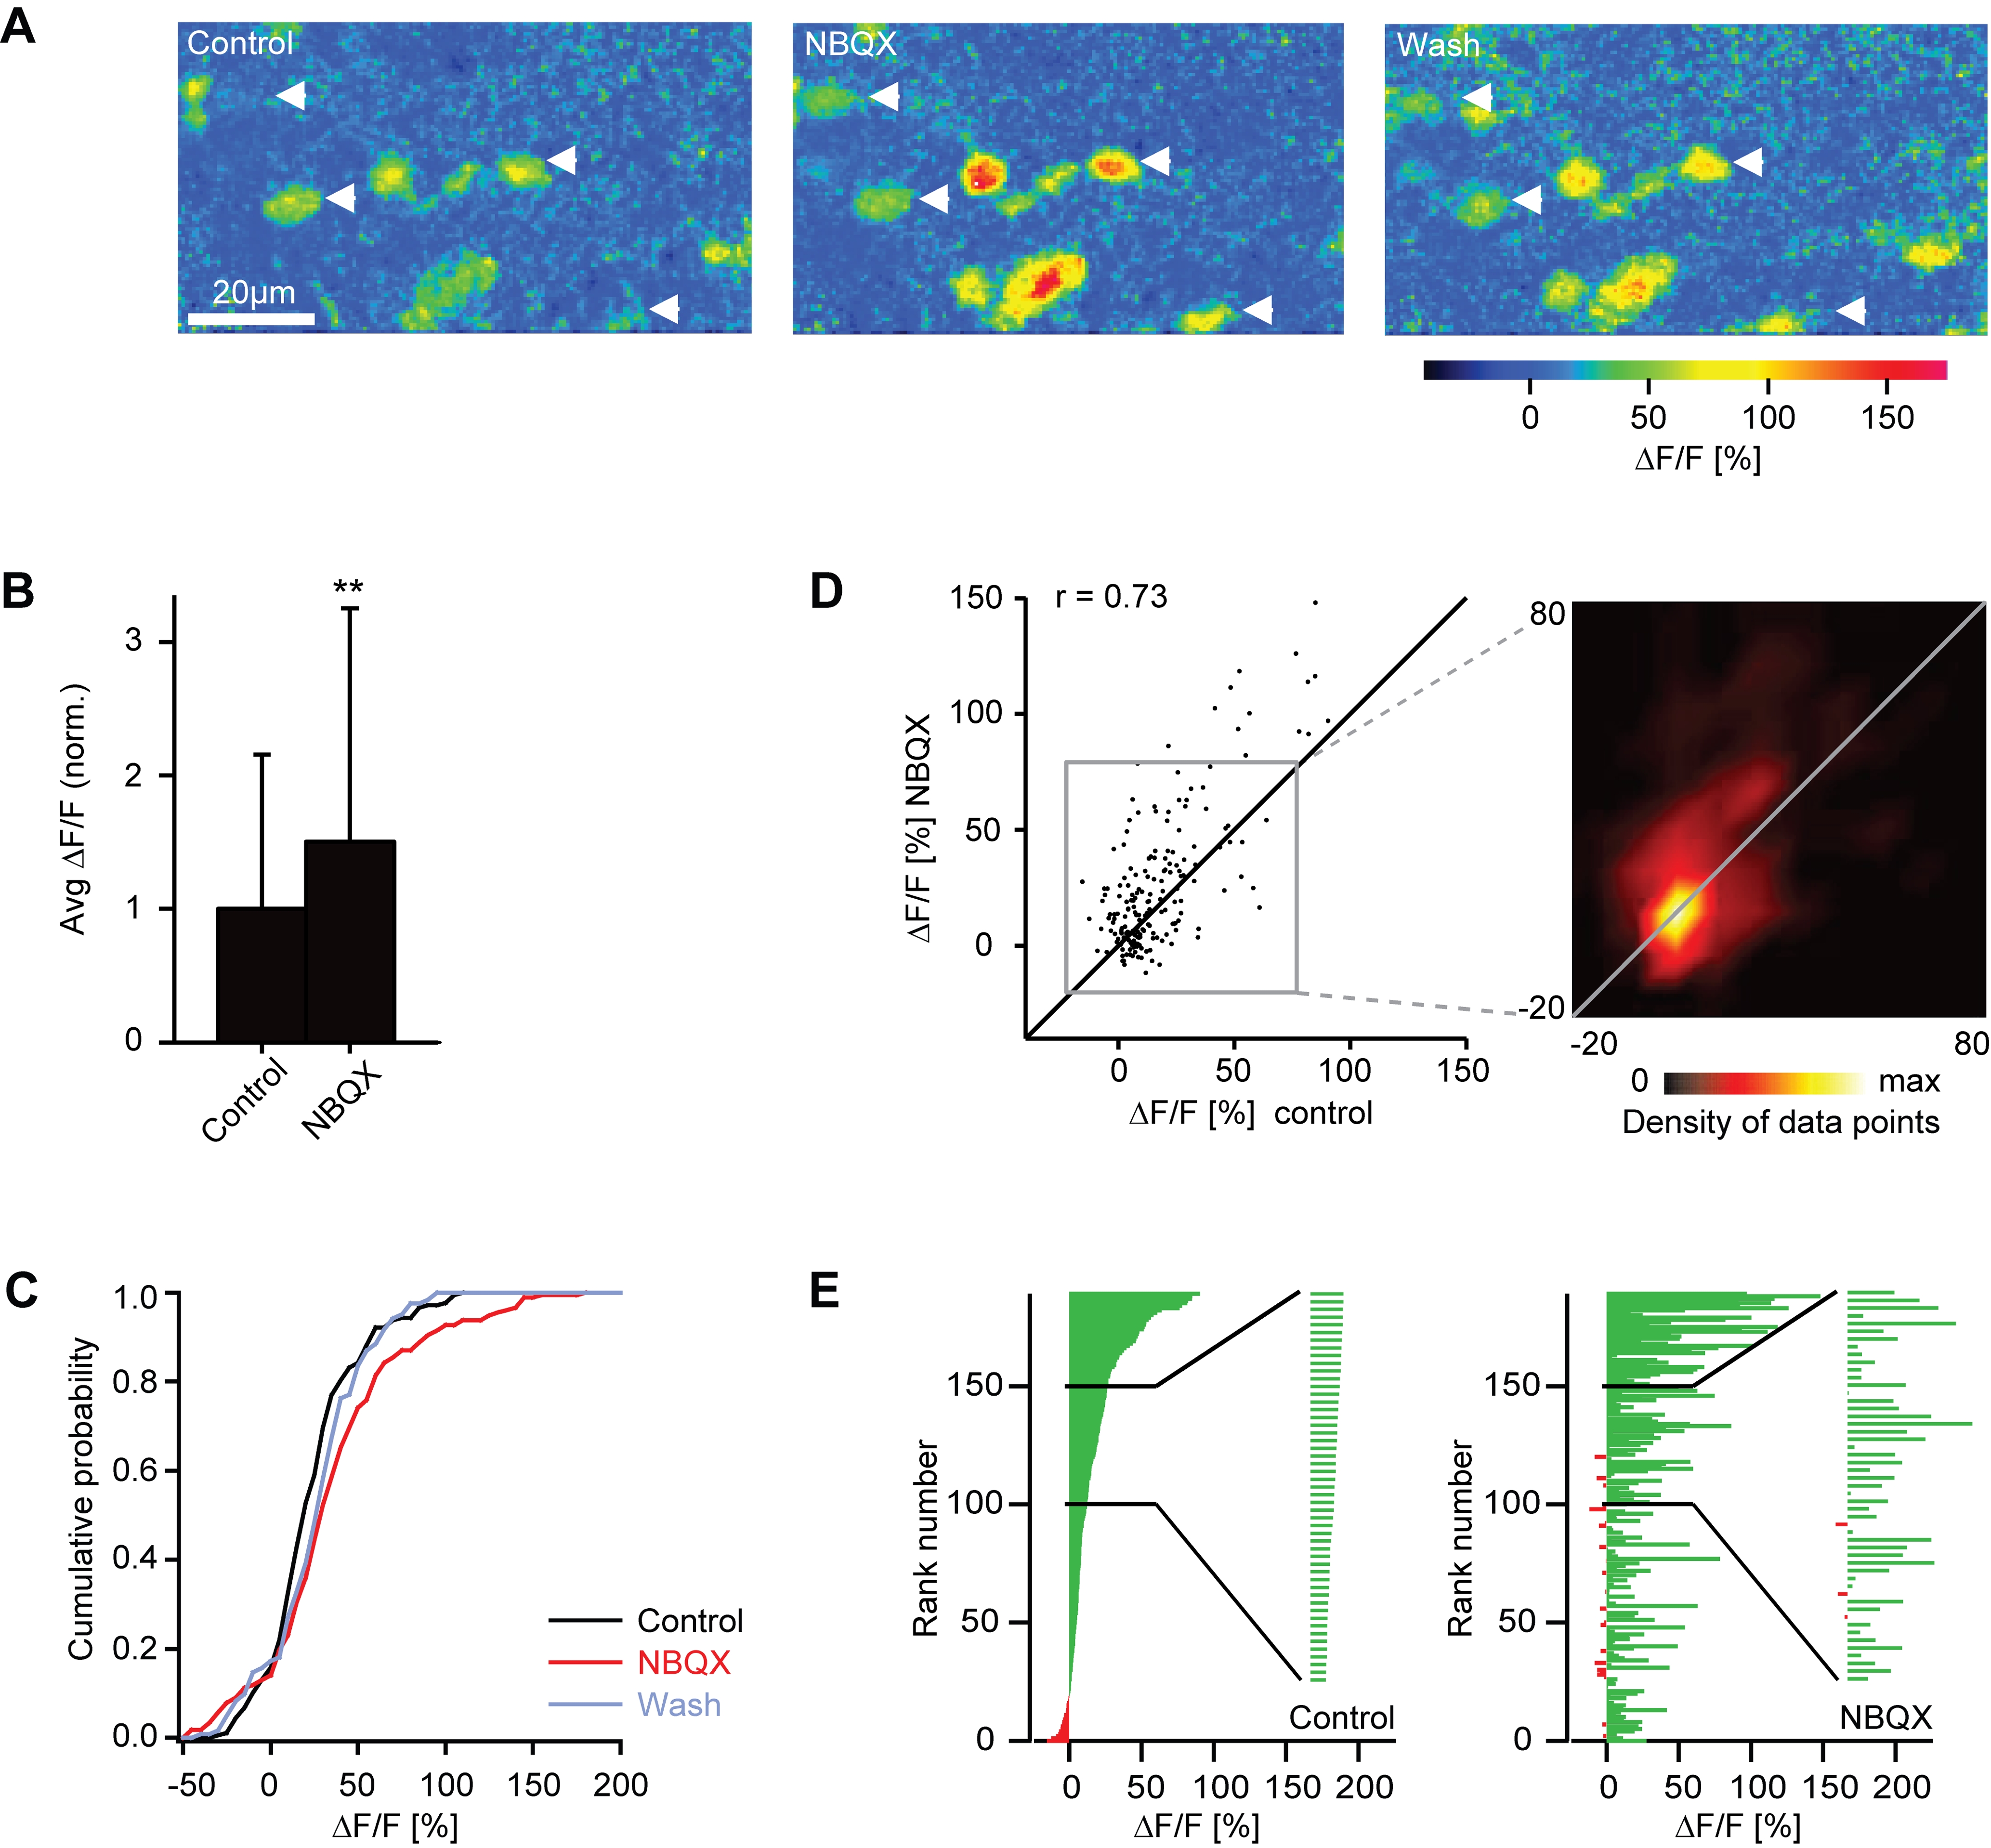
Fig. 8 Effect of NBQX on mitral cell responses measured by 2-photon Ca2+ imaging. (A) Odor-evoked Ca2+ signals in mitral cells before, during and after application of NBQX (stimulus: Trp, 10 µM). Arrows depict somata of neurons identified as mitral cells by expression of the genetically encoded fluorescence marker HuC-YC. (B) Average somatic Ca2+ signals before (control) and during application of NBQX, normalized to control. Error bars show standard deviation. **, P = 0.002 (sign test). (C) Cumulative distribution of Ca2+ signal amplitudes before (black) and during application of NBQX (red) and after washout (gray). (D) Comparison of Ca2+ signal amplitudes evoked by the same odors in the same mitral cells before and during application of NBQX. Data were pooled over all cells, odors and animals (n = 190 responses). r, Pearson correlation coefficient. Inset shows the density of data points in the boxed region. Lines are diagonals with slope one. (E) Left: mitral cell odor responses ranked according to the Ca2+ signal before application of NBQX. Inset shows an enlargement of a subregion. Right: Responses of the same mitral cells to the same odors in the presence of NBQX, ranked in the same order as in the control.
Image
Figure Caption
Acknowledgments
This image is the copyrighted work of the attributed author or publisher, and
ZFIN has permission only to display this image to its users.
Additional permissions should be obtained from the applicable author or publisher of the image.
Full text @ PLoS One

