
|
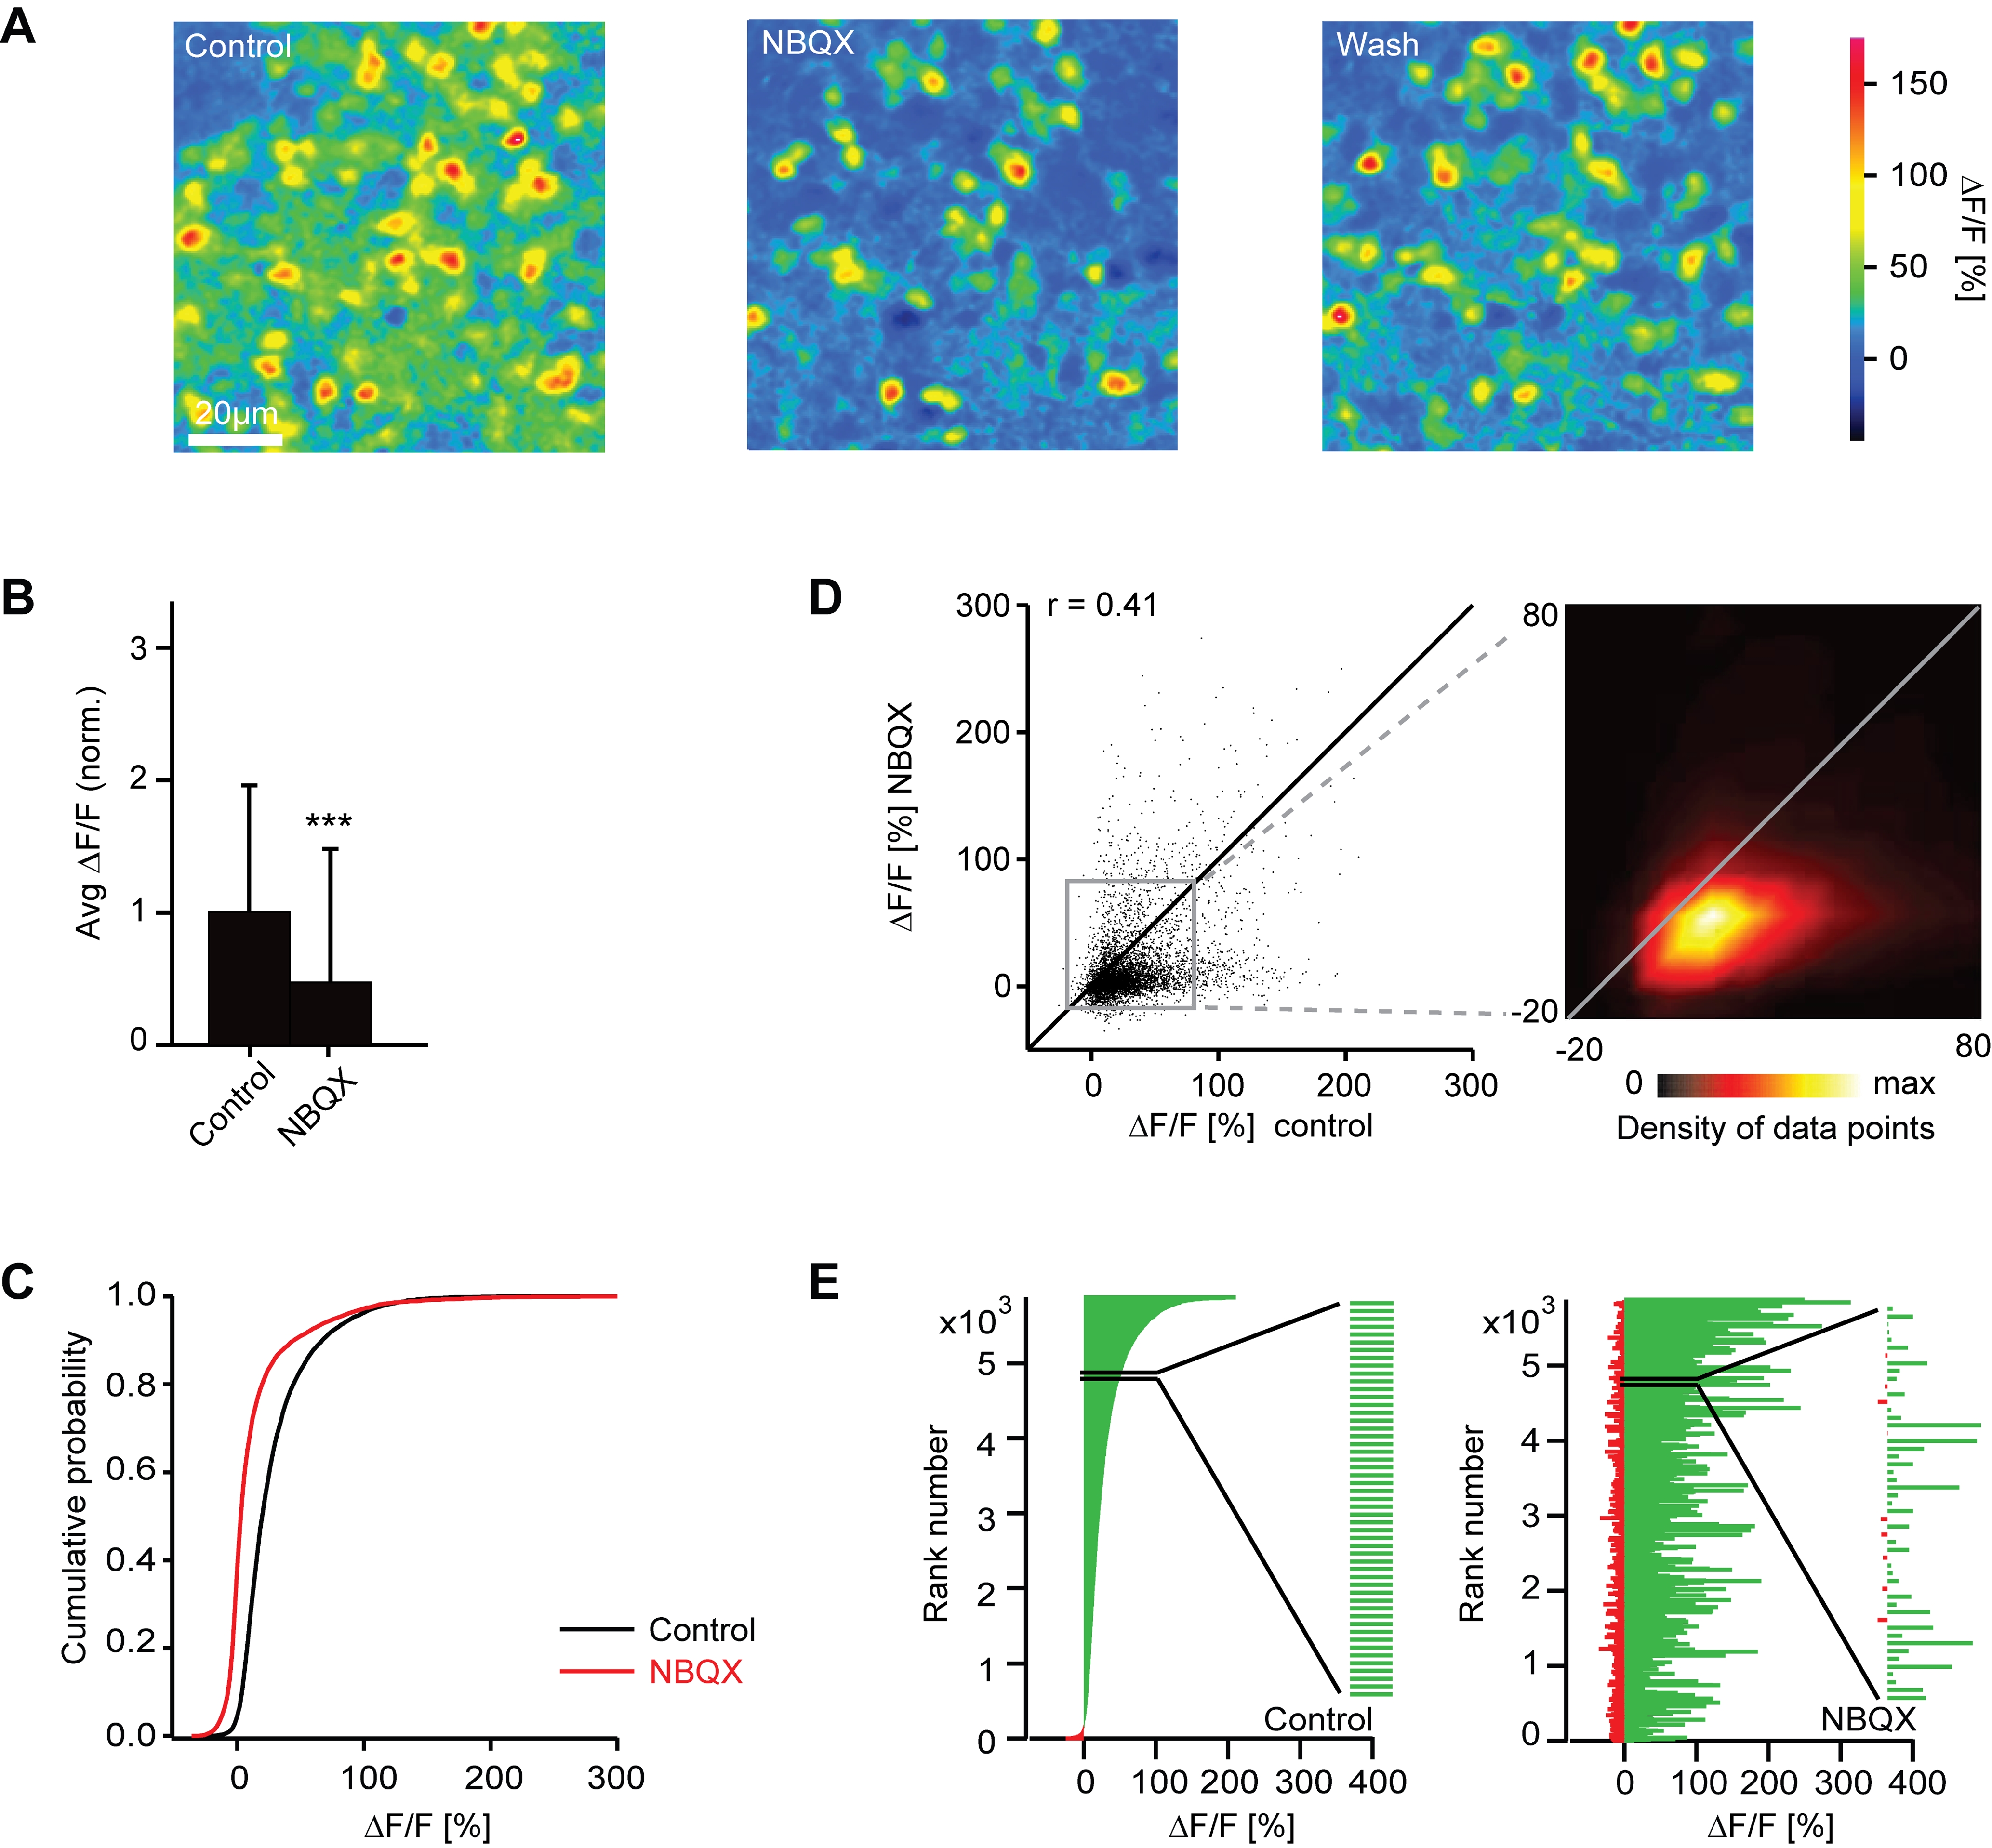
Fig. 10 Effect of NBQX on interneuron responses measured by 2-photon Ca2+ imaging. (A) Odor-evoked Ca2+ signals in interneurons before, during and after application of NBQX (stimulus: food odor). (B) Average somatic Ca2+ signals before (control) and during application of NBQX, normalized to control. Error bars show standard deviation. ***, P<0.001 (sign test). (C) Cumulative distribution of Ca2+ signal amplitudes before (black) and during (red) application of NBQX. (D) Comparison of Ca2+ signal amplitudes evoked by the same odors in the same interneurons before and during application of NBQX. Data were pooled over all cells, odors and anminals (n = 5878 responses). r, Pearson correlation coefficient. Inset shows the density of data points in the boxed region. Lines are diagonals with slope one. (E) Left: interneuron odor responses ranked according to the Ca2+ signal before application of NBQX. Right: Responses of the same interneurons to the same odors in the presence of NBQX, ranked in the same order as in the control. Inset shows an enlargement of a subregion to demonstrate that low-amplitude values are interspersed between high amplitude values. The visual impression in the full diagram that many amplitudes are increased during NBQX treatment is therefore an artifact caused by crowding of bars in the graph.