
|
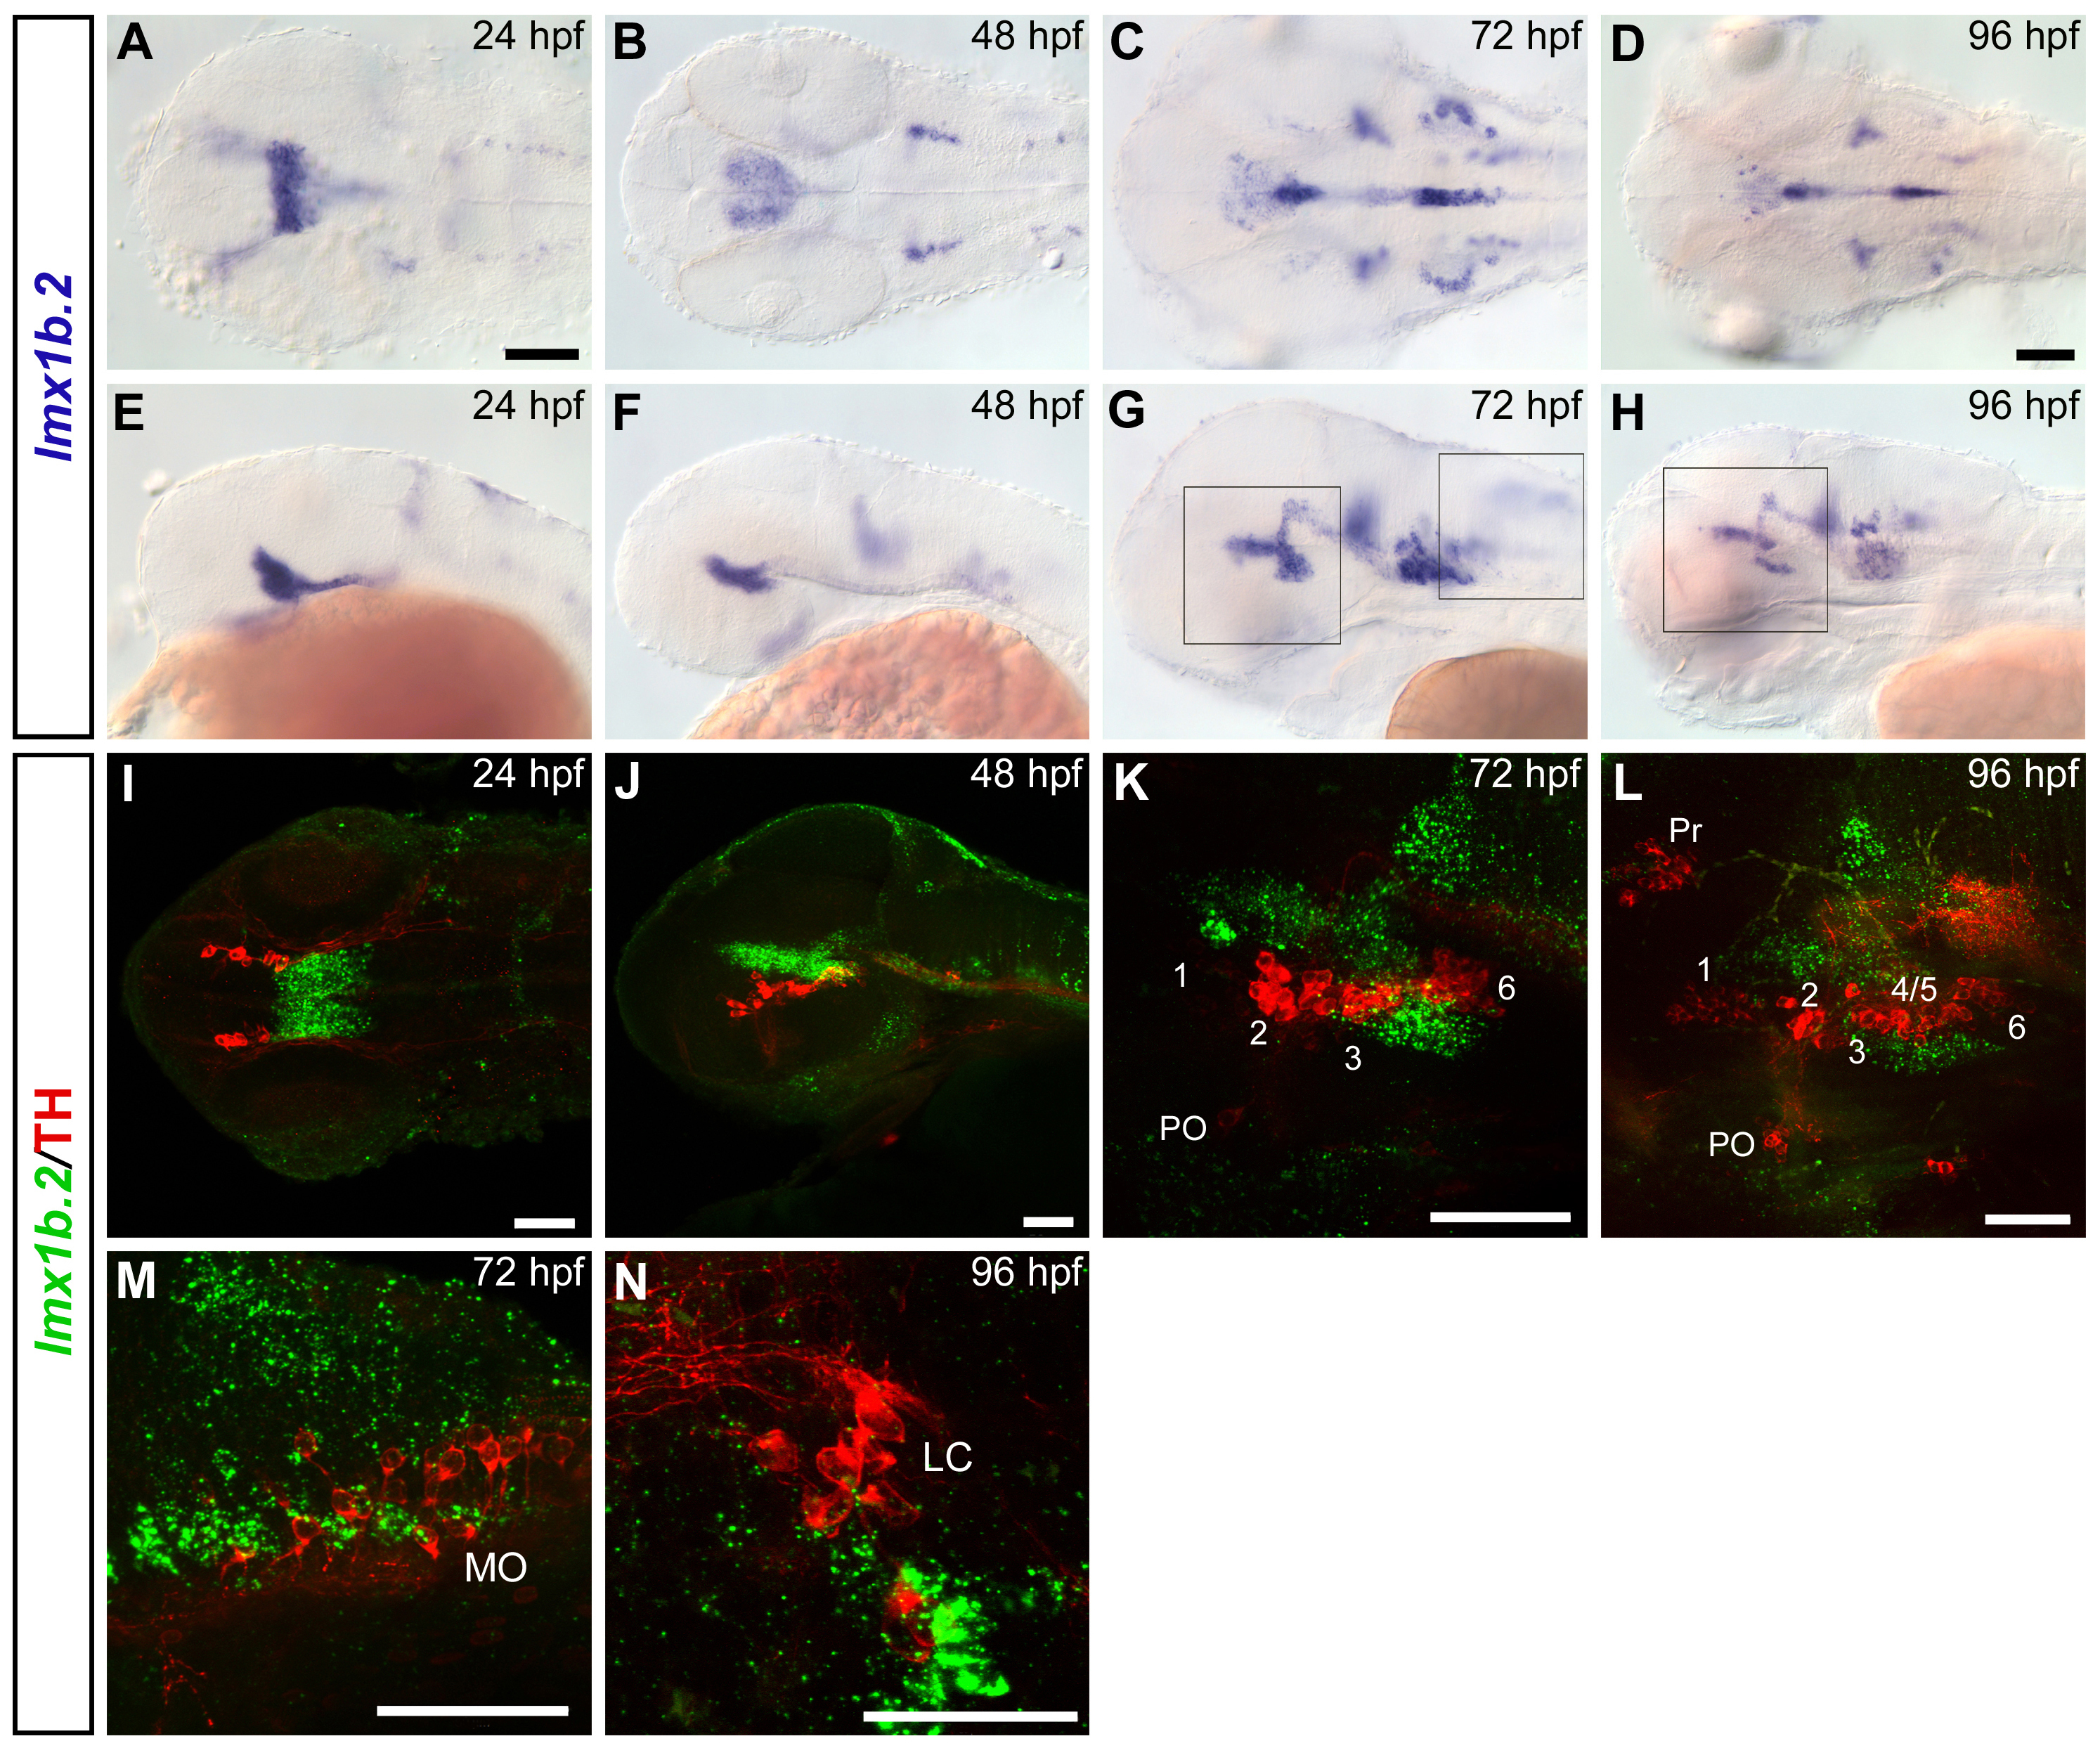
Fig. S8 lmx1b.2 is not co-expressed with TH in any CA group. (A-H) Whole mount in situ hybridization showing lmx1b.2 expression pattern at 24 hpf (A, E), 48 hpf (B, F), 72 hpf (C, G) and 96 hpf (D, H). Dorsal (A-D) and lateral (E-H) views of the head are represented, anterior is to the left. (I-N) Confocal z-projections of whole mount FISH to lmx1b.2 (green) followed by anti-TH immunohistochemistry (red) show the spatial relationship between lmx1b.2-expressing and THir cells. Although lmx1b.2-expressing cells in the diencephalon and in the hindbrain are often intermingled with THir neurons, no co-expression is observed in any of the CA groups. (I) Dorsal overview (32 μm projection) of a 24 hpf embryo. (J) Lateral overview (19 μm projection) of a 48 hpf embryo. (K) Lateral projection (57 μm) of the diencephalic area (framed in G). (L) Lateral projection (56 μm) of the framed region in H. (M) Lateral view (11 μm projection) of the NA neurons in the medulla oblongata at 72 hpf. (N) Dorsal view (6 μm projection) of the locus coeruleus at 96 hpf. Scale bar in A is for A-C, E-G and in D is for D, H: 100 μm. Scale bars in I-N′: 50 μm.