
|
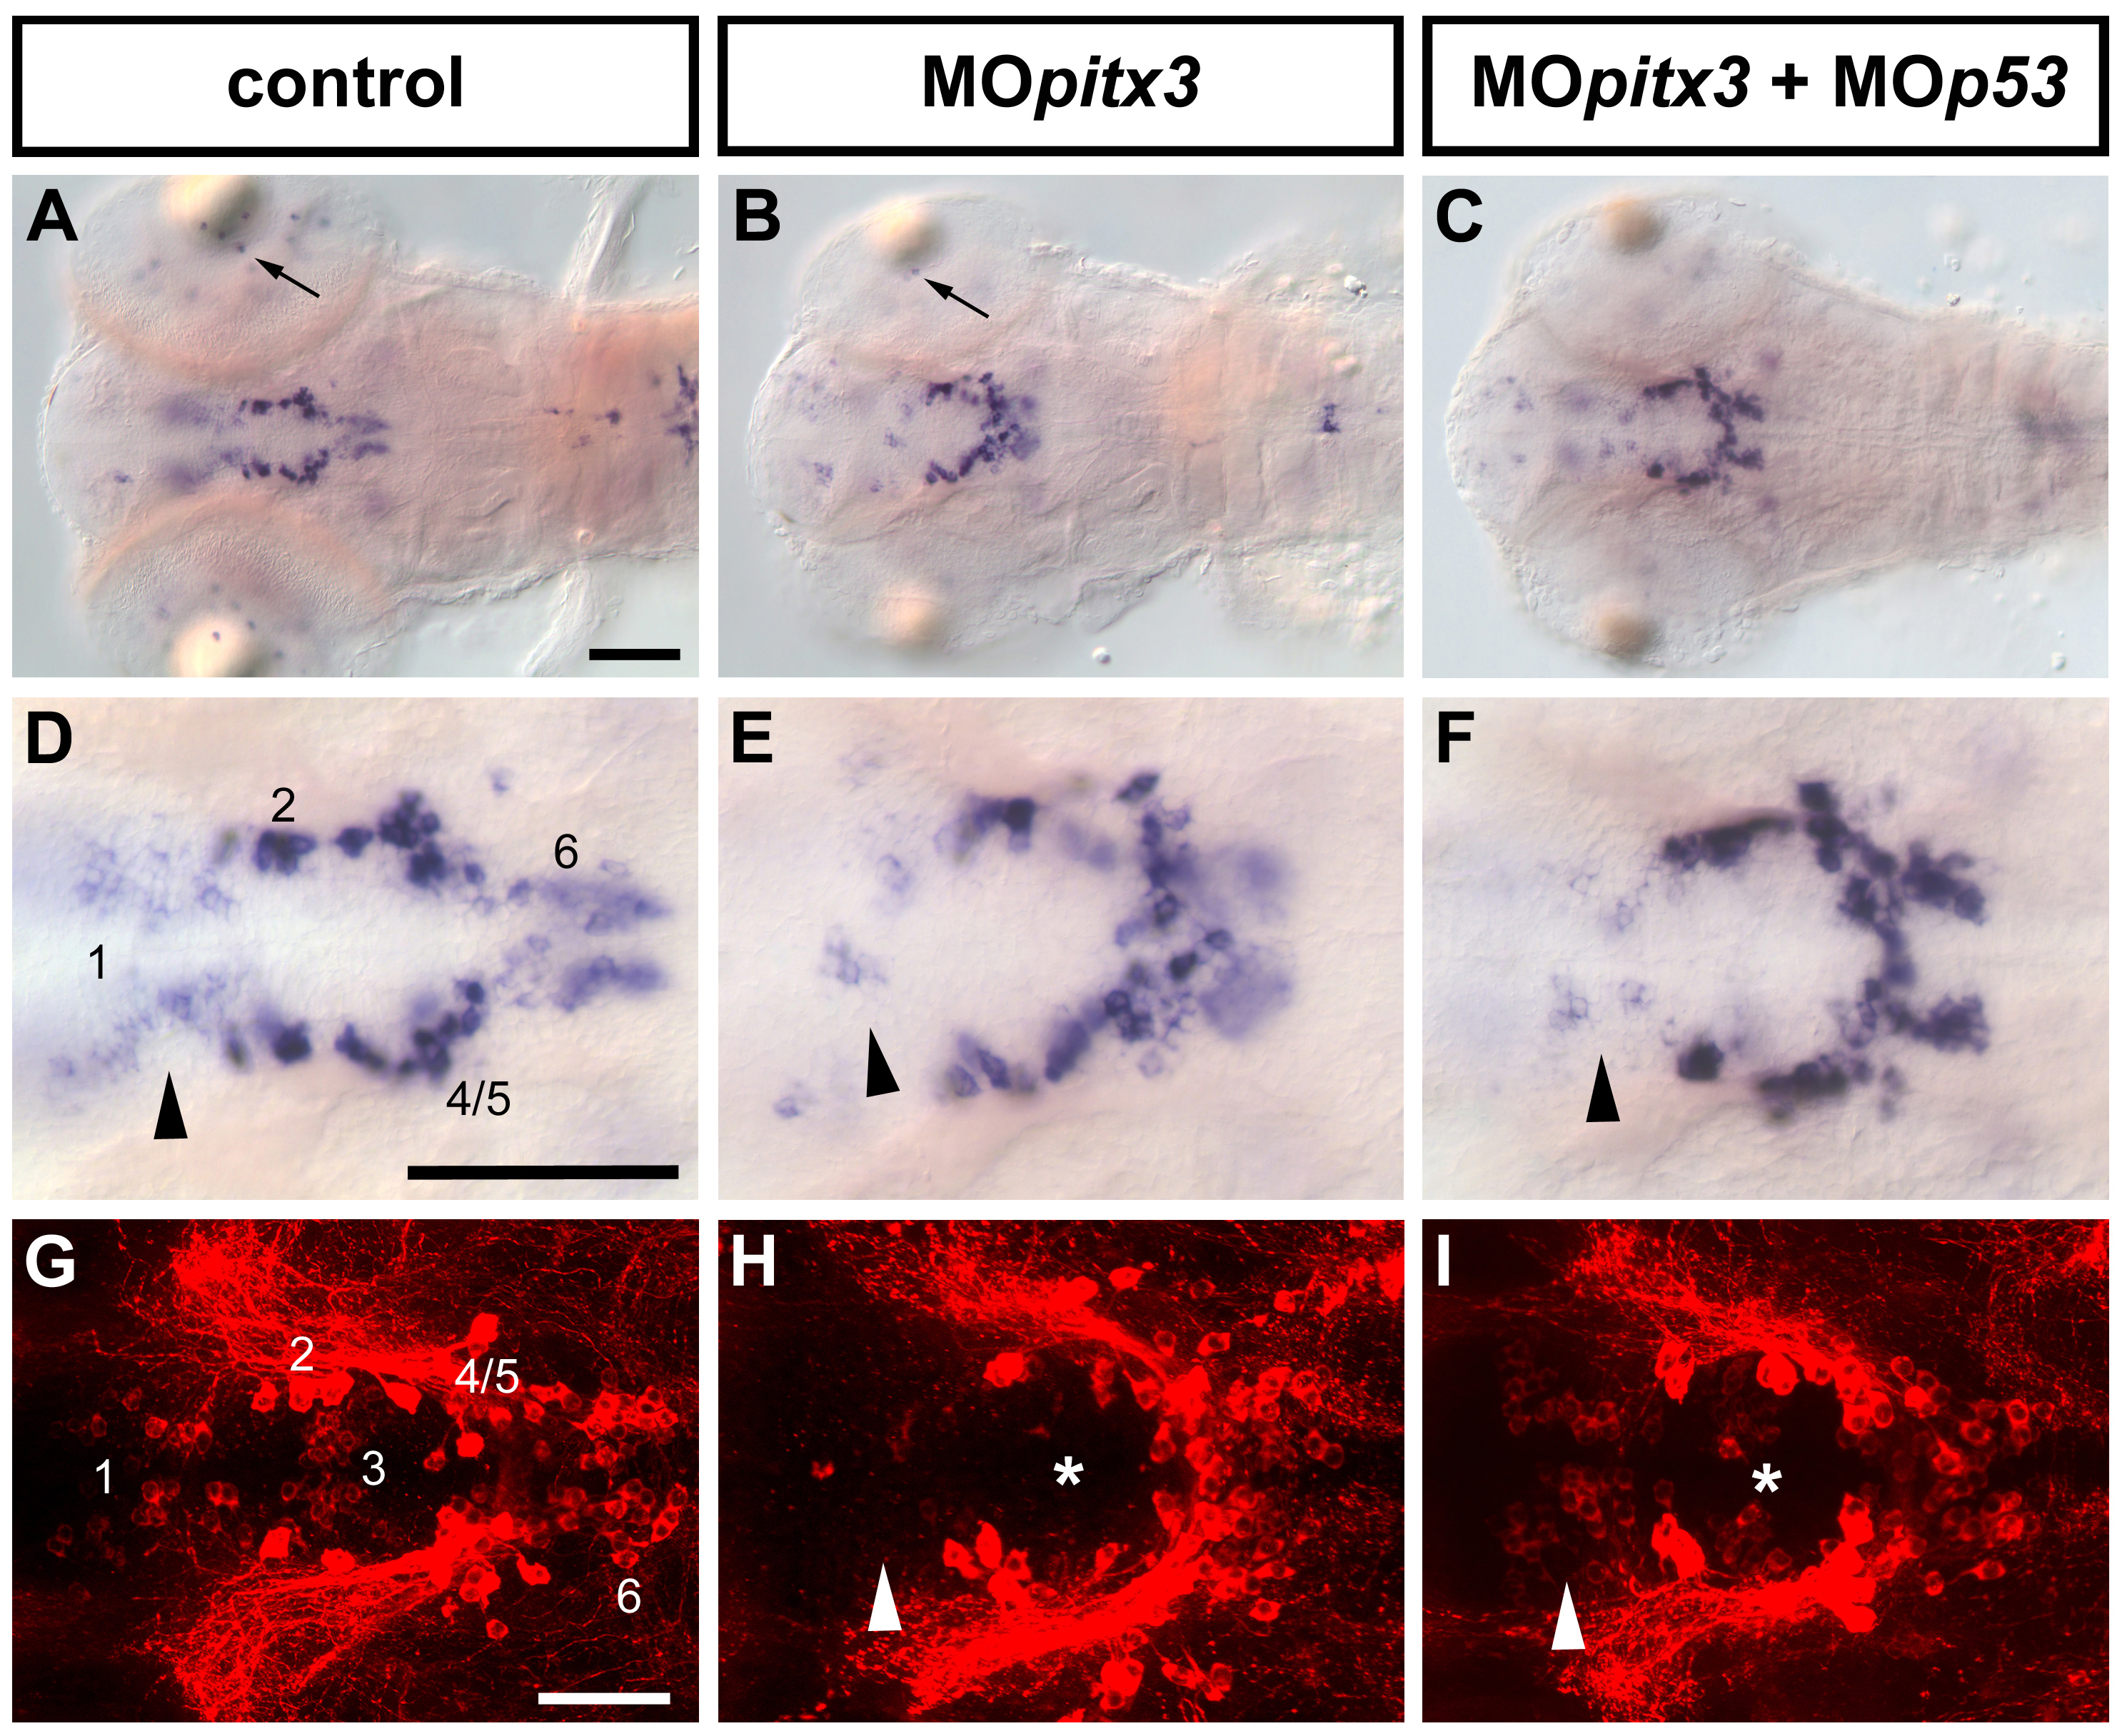
Fig. S10 Knock-down of pitx3. pitx3 morphants were analyzed at 96hpf for th expression by WISH (A-F) and anti-TH immunohistochemistry (G-I), to better visualize groups 1 and 3 in the vDC. (A, D, G) Control embryos show normal development of DA neurons in the retina (A, arrow) and the vDC. (B, E, H) Embryos injected with 2ng MOpitx3 form fewer DA amacrine cells (arrow) and show reduced th expression in vDC groups 1 and 3 (E and H, arrowheads point to group 1 and the asterisk to group 3), besides a slight disorganization of the DA groups. Head and eye sizes are decreased as reported by Shi et al. (2005). (C, F, I) Upon co-injection of 2 ng MOpitx3 and 4,5 ng MOp53, the embryos display an almost complete recovery of vDC groups 1 and 3, suggesting that this pitx3 morpholino induces off-target effects which lead to an unspecific loss of these groups. A-I: dorsal views. Anterior is to the left. Scale bar in A is for A-C and in D is for D-F: 100 μm; scale bar in G for G-I: 50 μm.