
|
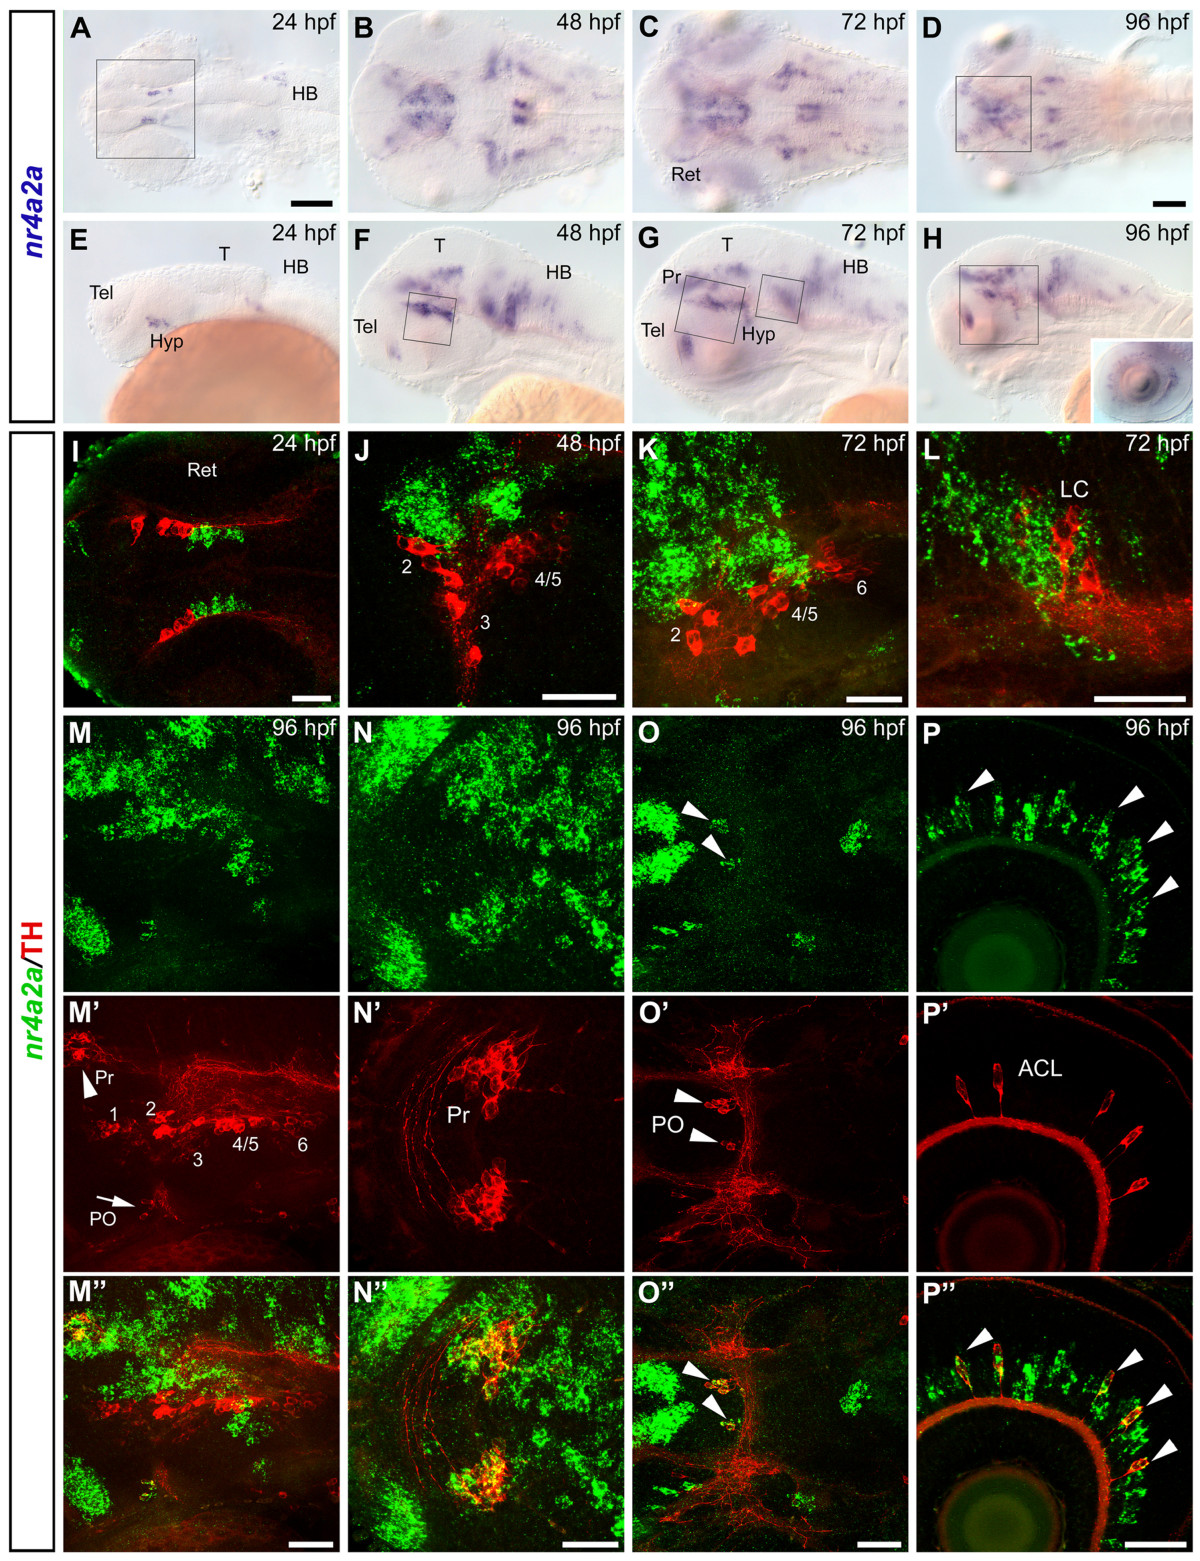
Fig. 1 nr4a2a is co-expressed with TH in DA neurons of the pretectum, the preoptic area and in amacrine cells of the retina. (A-H) Whole mount in situ hybridization showing nr4a2a expression pattern at 24 hpf (A, E), 48 hpf (B, F), 72 hpf (C, G) and 96 hpf (D, H). Dorsal (A-D) and lateral (E-H) views of the head, anterior is to the left. (I-P″) The spatial relationship between nr4a2a-expressing cells and CA neurons in different areas of the brain was analyzed by whole mount FISH to nr4a2a (green) and anti-TH immunohistochemistry (red). Expression was documented by confocal stacks of images, and information for regions corresponding to specific CA neuronal groups was summarized by generation of z-projections from subsets of focal planes of these stacks. (I) Dorsal overview of a 24 hpf embryo (35 μm projection, the approximate head region framed in A is shown): the THir domain is located anterior to the diencephalic nr4a2a domain but there is no co-expression. (J) High magnification of the diencephalic DA clusters at 48 hpf (18 μm projection, approximate area framed in F). (K) High magnification of the diencephalic DA clusters at 72 hpf (15 μm projection, approximate area delimited by the big frame in G). (L) High magnification of the region of the locus coeruleus at 72 hpf (6 μm projection, approximate area delimited by the small frame in G). (M-M″) Lateral view of a 96 hpf embryo showing the brain region framed in H (23 μm projection): nr4a2a (green channel, M) and TH (red channel, Mμ); co-expression is detectable in the pretectum (Pr, arrowhead in Mμ) and in the preoptic area (PO, arrow in Mμ) (merged channels: M″). High magnification dorsal views of the pretectal area and the preoptic dopaminergic neurons are shown respectively in N-N″ (6 μm projection, approximate area framed in D) and in O-O″ (11 μm projection, arrowheads). (P-P″) nr4a2a is expressed in numerous cells of the inner nuclear layer of the retina (P and inset in H), and in all THir amacrine cells (P′-P″, arrowheads). In this and in the following figures the DA groups in the ventral diencephalon are numbered from 1 to 6, according to [28]. I, N-N″, O-O″, dorsal views; J, K, L, M-M″, P-P″, lateral views; anterior is to the left. Scale bar in A for A-C, E-G and in D for D, H: 100 μm; scale bars in I-P″: 50 μm. Abbreviations: ACL, amacrine cell layer; HB, hindbrain; Hyp, hypothalamus; LC, locus coeruleus; PO, preoptic area; Pr, pretectum; T, tectum; Tel, telencephalon; Ret, retina.