
Fig. 2
- ID
- ZDB-IMAGE-080113-2
- Genes
- Publication
- Kallivretaki et al., 2007 - The zebrafish, brain-specific, aromatase cyp19a2 is neither expressed nor distributed in a sexually dimorphic manner during sexual differentiation
- All Figures
- Figures for Kallivretaki et al., 2007
|
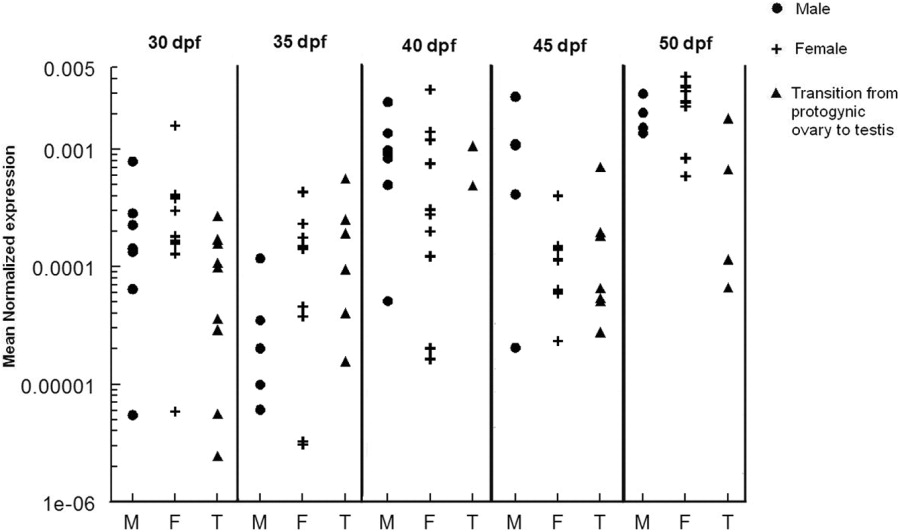
Fig. 2 Ontogeny of cyp19a2 mRNA levels in the brains of juvenile zebrafish. Fish were collected throughout the process of gonadal differentiation (30, 35, 40, 45, 50 dpf), and the heads were used for RNA extraction and quantification of cyp19a2 transcript abundance, while the bodies were kept for histological evaluation of gonadal status. Males are represented as black filled circles, females as crosses, and animals undergoing transition from stage I oocyte to testis as black filled triangles. At 50 dpf, transcript levels were significantly higher compared with all other stages (Wilcoxon test). The results are expressed as mean normalized expression (MNE; Muller et al., [2002]). Gene levels were normalized against 18S.