
Fig. 9
- ID
- ZDB-IMAGE-080107-24
- Publication
- Yokogawa et al., 2007 - Characterization of Sleep in Zebrafish and Insomnia in Hypocretin Receptor Mutants
- All Figures
- Figures for Yokogawa et al., 2007
|
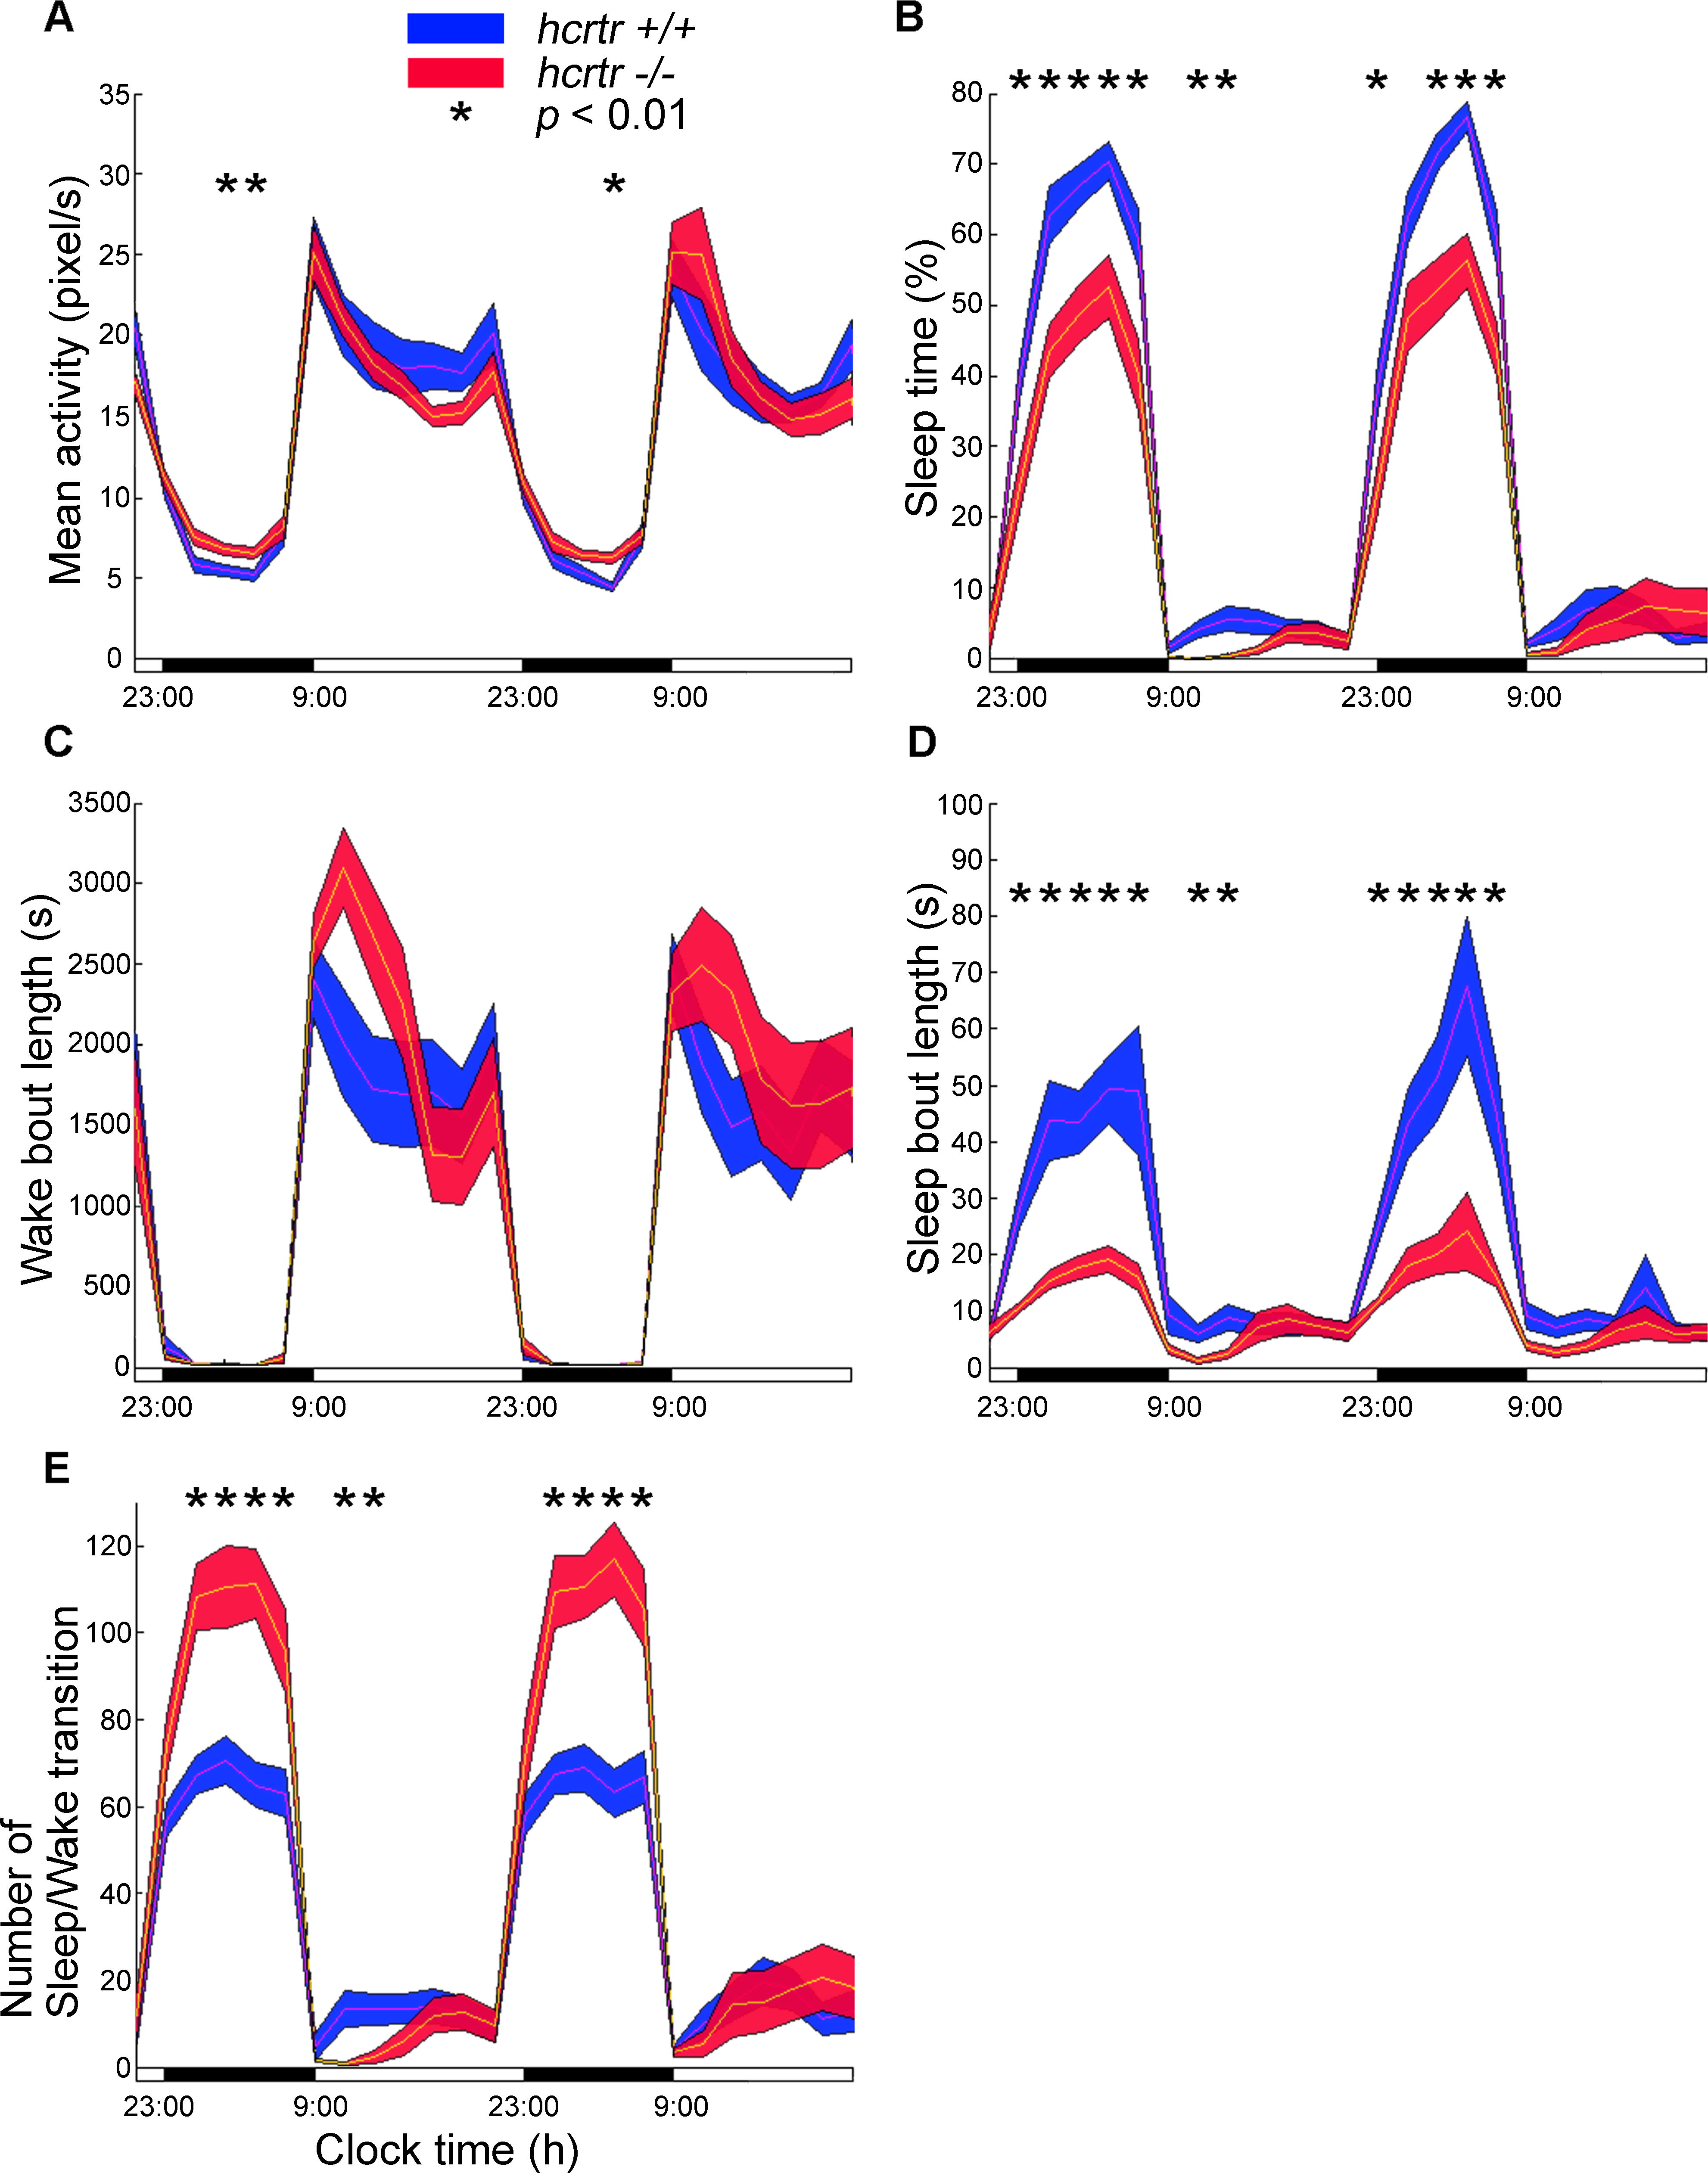
Fig. 9 Sleep-Wake Patterns in hcrtr168 Mutants versus Wild-Type
Recordings were performed using the AFSRS over 48 h after 3 d of habituation. Data are plotted every 2 h. (Wild-type, n = 22; homozygous mutant, n = 17).
(A) Activity patterns. Note slightly increased activity (+20%) in mutant fish during the night.
(B) Percent sleep per hour. Note decreased sleep amounts (-30%) in mutant fish during the entire night.
(C) Mean wake bout length per hour (calculated as the mean period length of the non-sleep periods each hour) is similar in both genotypes.
(D) Mean sleep bout length per hour. Note dramatic decrease in sleep bout length (-65%) during the night in mutant animals.
(E) The number of sleep-wake transitions per hour increases dramatically in hcrtr168 mutants during the night (+60%).
For overall means of these parameters across the dark and light periods, and during other light cycles, see Table 1.