
|
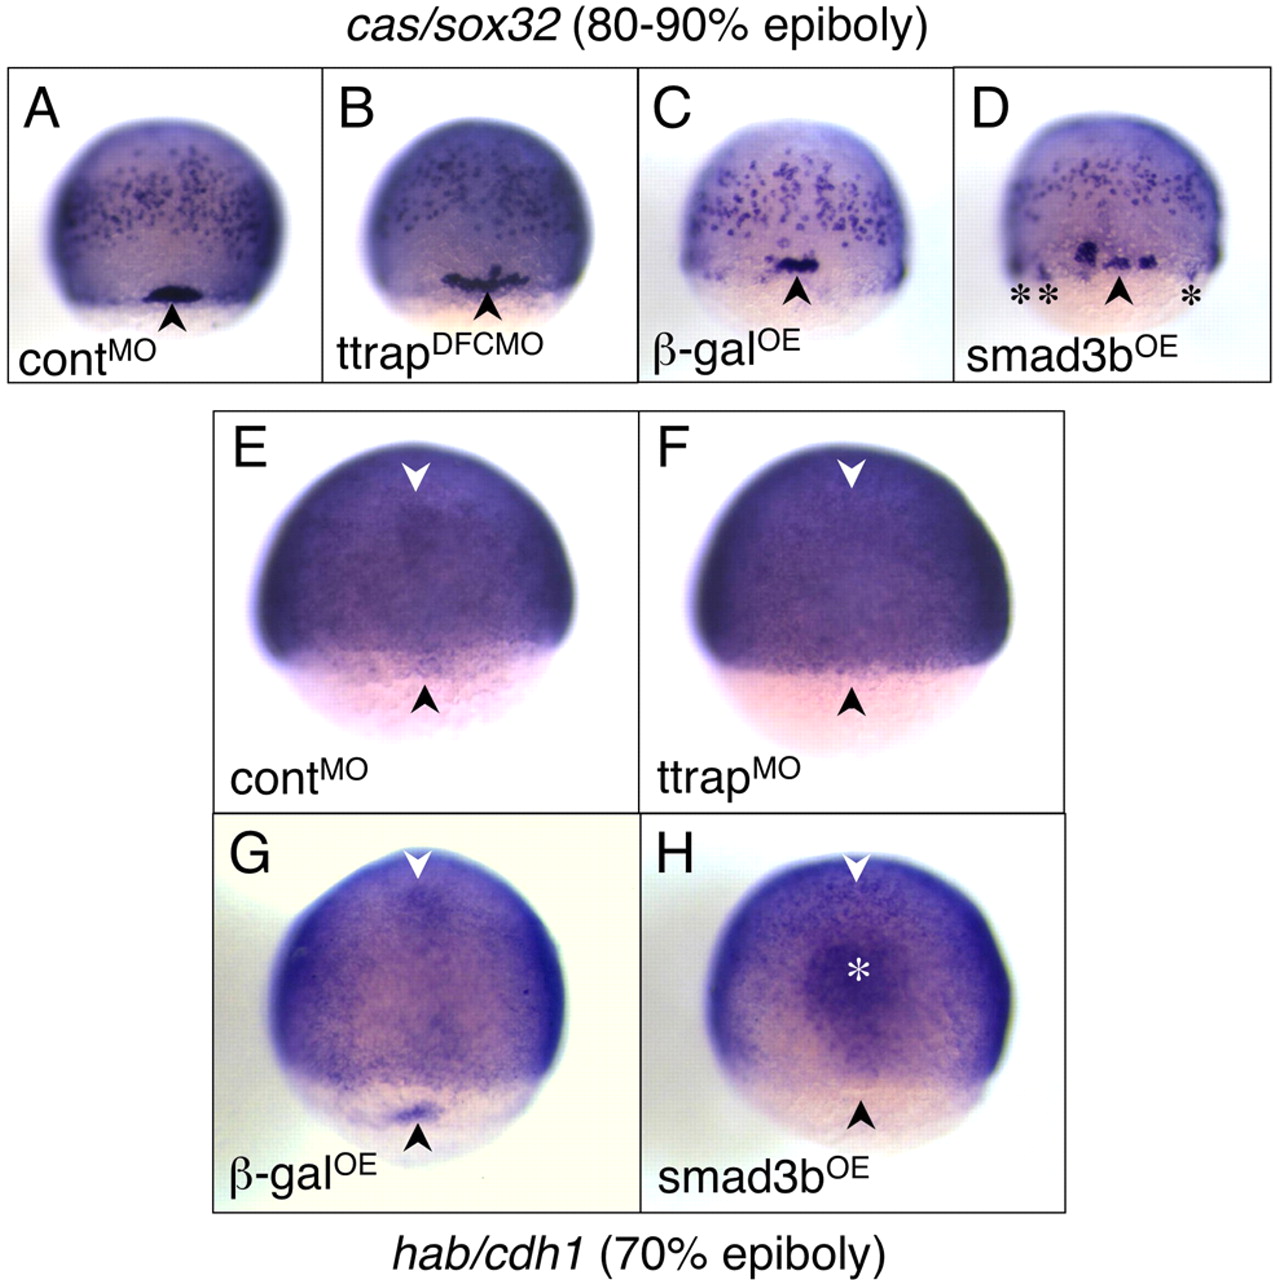
Fig. 9 Aberrant DFC migration and clustering as a result of Ttrap-Smad3-mediated downregulation of cdh1. (A-D) cas/sox32 as DFC marker, 80-90% epiboly. (A,C) Tight clustering of DFCs (black arrowheads) in controlMO and βgalOE embryos. (B,D) In TtrapMO and Smad3bOE embryos, DFCs are more spread out. Occasionally, DFCs are also ectopically located around and just underneath the blastoderm margin (black asterisks). (E-H) cdh1 is absent in DFCs and anterior axial hypoblast of TtrapMO and Smad3bOE embryos, 70% epiboly. General cdh1 expression in the epiblast remains unaltered in all embryos; the embryos are deliberately overstained. (E,G) cdh1 in DFCs (black arrowheads) and anterior axial hypoblast (white arrowheads) visible in controlMO and βgalOE embryos and missing in (F) TtrapMO and (H) Smad3bOE embryos. In Smad3bOE embryos, stronger staining in the prechordal plate (white asterisk) was also observed and may be a consequence of a thickening of this region because of hyperdorsalization. Dorsal views, anterior at top.