
|
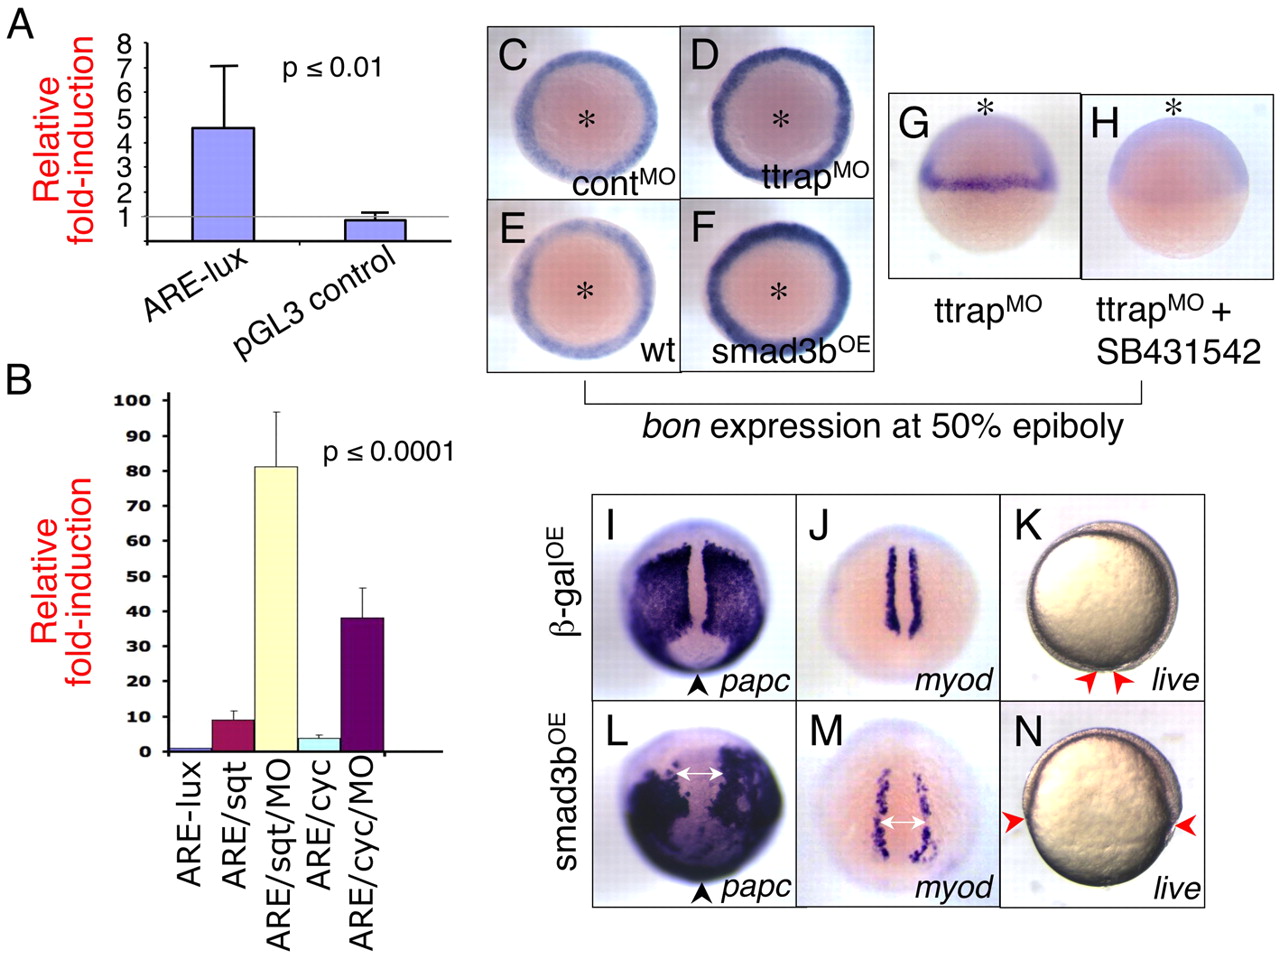
Fig. 7 Ttrap knockdown modulates Nodal-Alk4 signaling. (A) Ttrap knockdown increases activity of ARE-luciferase reporter. ARE-lux plasmid (50 pg) was co-injected with TtrapMO (or controlMO) and embryo lysates assayed for luciferase at shield stage. Knockdown results in ∼fivefold greater induction relative to control (4.6±2.5; P≤0.01; Student's unpaired t-test; eight independent experiments). No significant increase in luciferase was detectable for control pGL3. (B) TtrapMO potentiates ARE-lux by sqt or cyc. This experiment was performed as described in A, this time in combination with sqt or cyc mRNA injection (11 pg). The addition of TtrapMO induced ARE-lux an additional tenfold relative to induction by either one of the ligands [81.0±15.6 (ARE+sqt+TtrapMO) vs 9.0±2.6 (ARE+sqt); 38.0±8.6 (ARE+cyc+TtrapMO) vs 3.8±0.8 (are+cyc); P≤0.0001, One-way analysis of variance (ANOVA)]. y-axis, fold-induction of luciferase. (C-F) bon is visibly upregulated in TtrapMO and Smad3bOE embryos; WISH at 50% epiboly, animal views (asterisks). (G,H) TtrapMO-mediated increase in bon expression depends on intact alk4 activity. (G) TtrapMO embryo shows strong expression of bon, whereas (H) TtrapMO embryo treated with SB431542 no longer expresses bon. Animal views (asterisks). (I-N) Overexpression of Smad3b causes CE and epiboly defects. WISH at 90% epiboly, paraxial mesoderm marker expression in βgalOE (700 pg) and Smad3bOE (700 pg) embryos. Dorsal-posterior views, anterior at top. (I,L) papc cells fail to converge near the midline in Smad3bOE embryos compared with control βgalOE embryos. Arrowheads indicate blastopore opening, which is wider in Smad3bOE embryos. (J,M) Distance between myod cells is greater in Smad3bOE relative to control embryos (double-headed arrows). (K,N) Live observation of β-galOE and Smad3bOE embryos, 90% epiboly. (K) Control β-galOE embryo displaying normal epiboly and nearing blastopore closure. (N) Smad3bOE embryo showing severe delay in epiboly. Red arrowheads, edge of blastoderm margin. Lateral views, anterior at top. Note that the gastrulation defects depicted here are at an earlier timepoint than those shown for TtrapMO embryos (see Fig. 2). Importantly however, the same gastrulation defects were also observed for TtrapMO embryos at this earlier stage (i.e. 90% epiboly).