
|
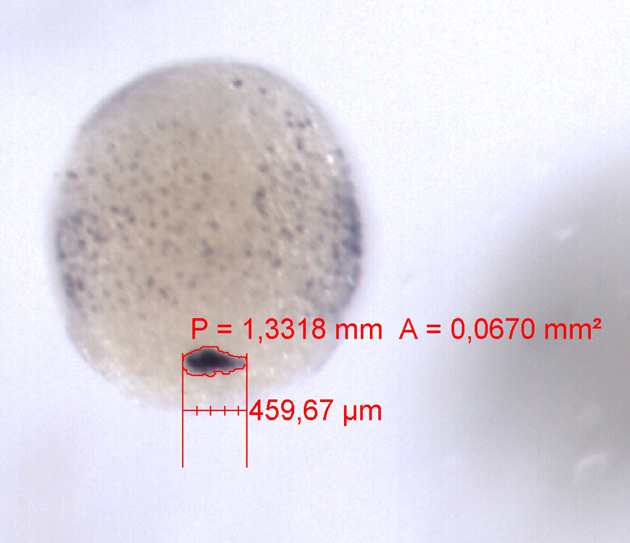
Fig. S8 Comparative quantification of DFC number and domain width along lateral margin between TtrapMO and controlMO embryos. Embryos were microinjected with either Ttrap MO or scrambled control MO and fixed with 4% PFA at shield, 70-80% epiboly and bud stages. DFCs were visualized via whole-mount in situ hybridization using sox32/casanova as a probe. Cell counts were performed manually using a 200× magnification of the DFC stained region. Widths of DFC sox32/cas expression domains were obtained and recorded by measuring the points between the outermost cells. Photographs and measurements of each embryo were taken using a Deltapix digital camera and the annotations function of the DpxView Pro Image Management Software (Deltapix AS, Denmark; see example of screen capture image below) respectively. Note: embryos are somewhat wider in diameter (approx. 1-1.2 mm) than live equivalent, most likely due to processing during in situ hybridization and the final rehydration process after clearing. Zoom factor in program also results in final width measurement that is 1.75× greater than actual sample. However, this zoom factor was taken into account when calculating final distances.