
|
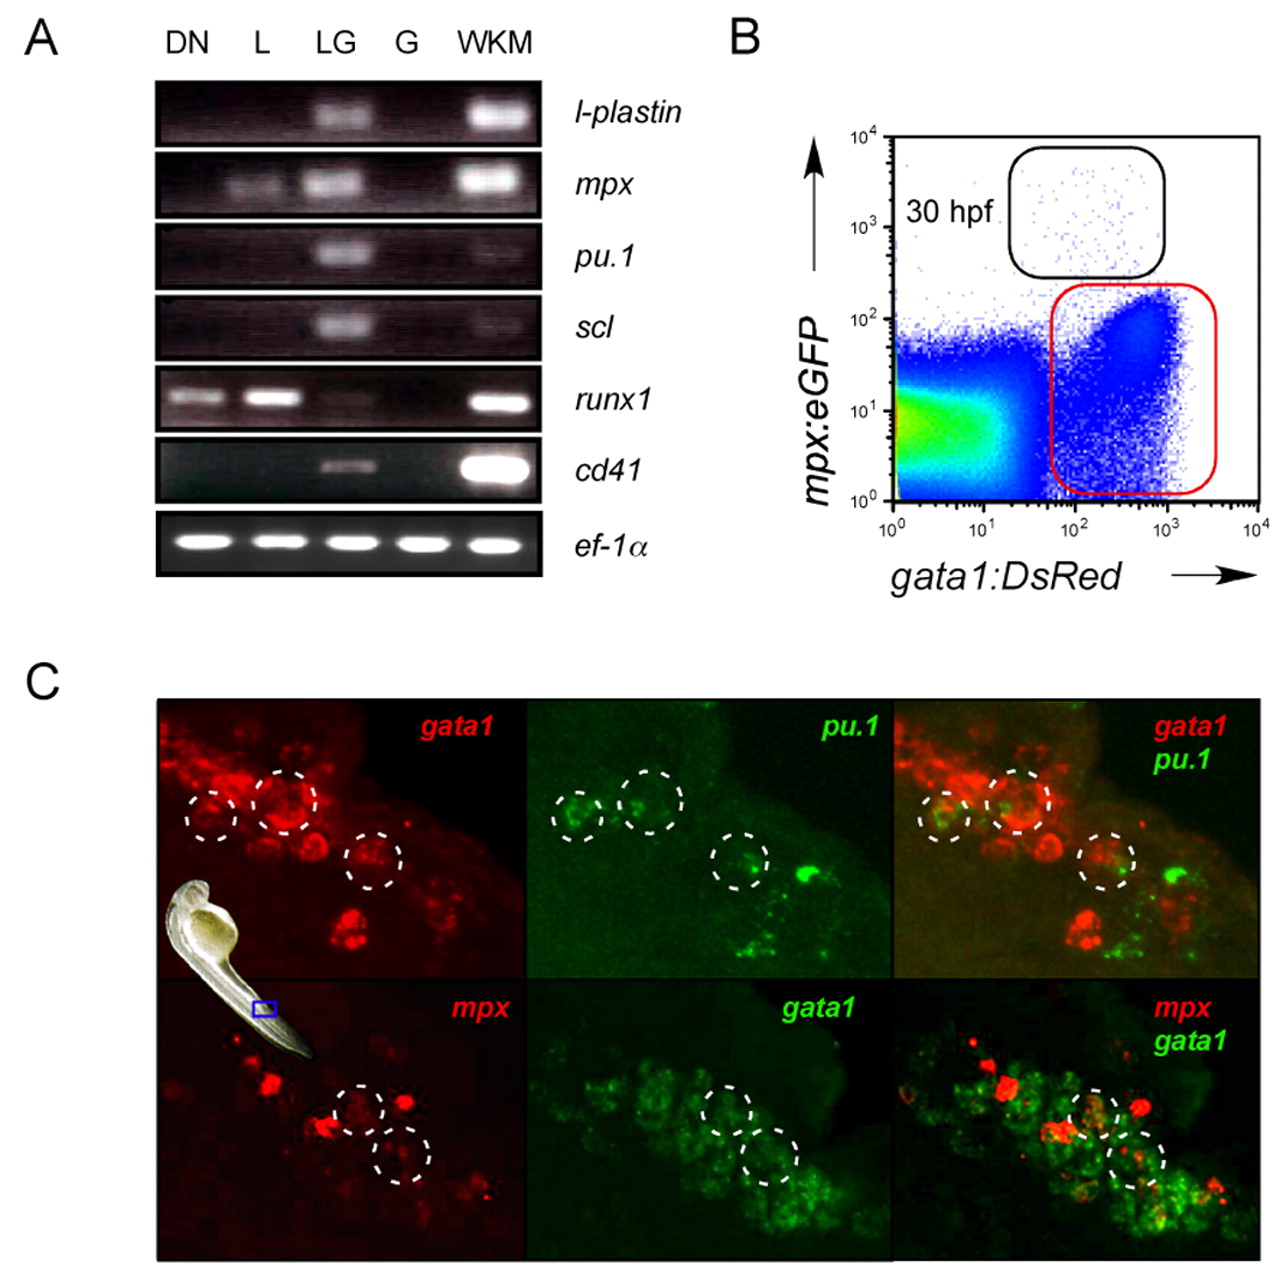
Fig. 3 Gene expression profiling of hematopoietic precursors in the PBI suggest multipotency. (A) Cells were purified from 30 hpf embryos by flow cytometry based on expression of gata1:DsRed and lmo2:eGFP transgenes (DN, double negative; L, lmo2:eGFP+, gata1:DsRed-; LG, lmo2:eGFP+, gata1:DsRed+; G, lmo2:eGFPlow, gata1:DsRed+; WKM, whole kidney marrow) and subjected to RT-PCR. (B) FACS analysis shows a population that coexpresses the gata1:DsRed and mpx:eGFP transgenes at 30 hpf (black gate). (C) Two-color FISH demonstrates that cells within the PBI at 30 hpf coexpress gata1 and pu.1 (highlighted circles, upper panels) and gata1 and mpx (highlighted circles, lower panels). Blue frame on embryo denotes regions shown in C at 400x magnification.