Image


                        Figure Caption


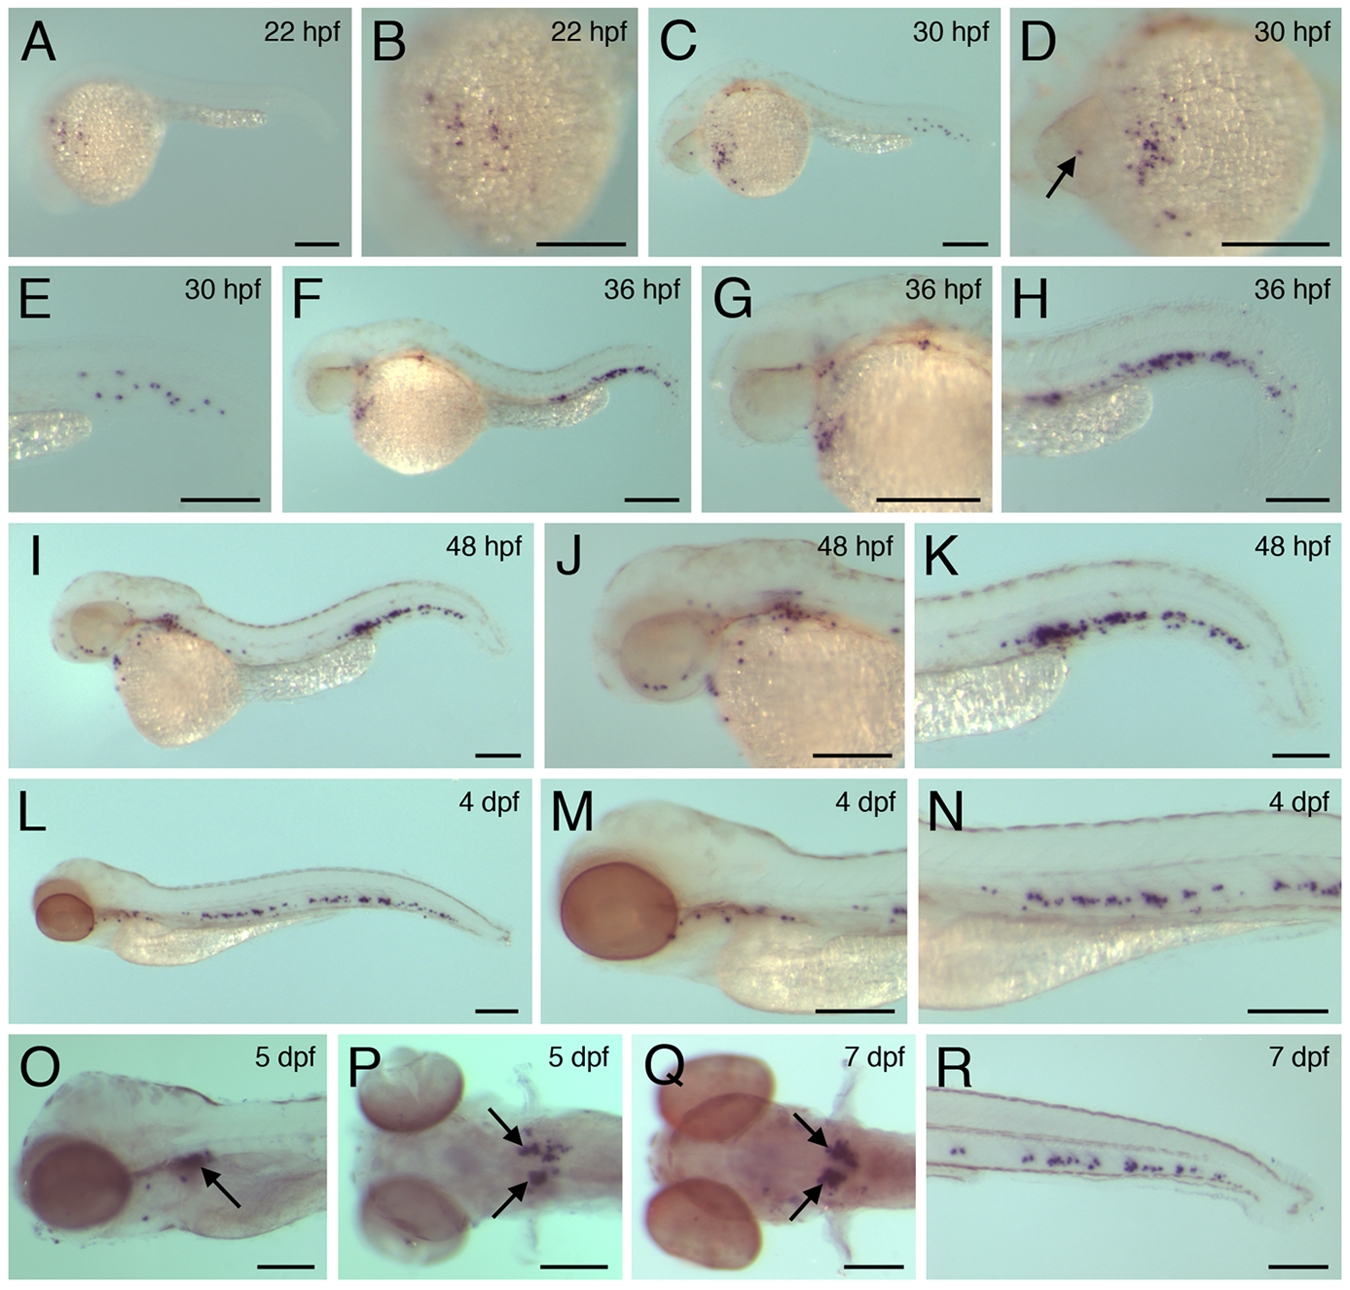
Fig. S1 lysC expression during early embryonic/larval development. lysC expression within 22 hpf (A and B), 30 hpf (C-E), 36 hpf (F-H), 48 hpf (I-K), 4 dpf (L-N), 5 dpf (O and P) and 7 dpf (Q and R) zebrafish embryos and larvae. Arrow in D denotes lysC-expressing cell within head mesenchyme. Arrows in O-Q denote lysC transcripts within the developing pronephric glomerulus. Scale bars: 200 μm.
                
                    
                        Figure Data


                        Acknowledgments


This image is the copyrighted work of the attributed author or publisher, and
ZFIN has permission only to display this image to its users.
Additional permissions should be obtained from the applicable author or publisher of the image.
      Full text @ BMC Dev. Biol.


        