
Image
|
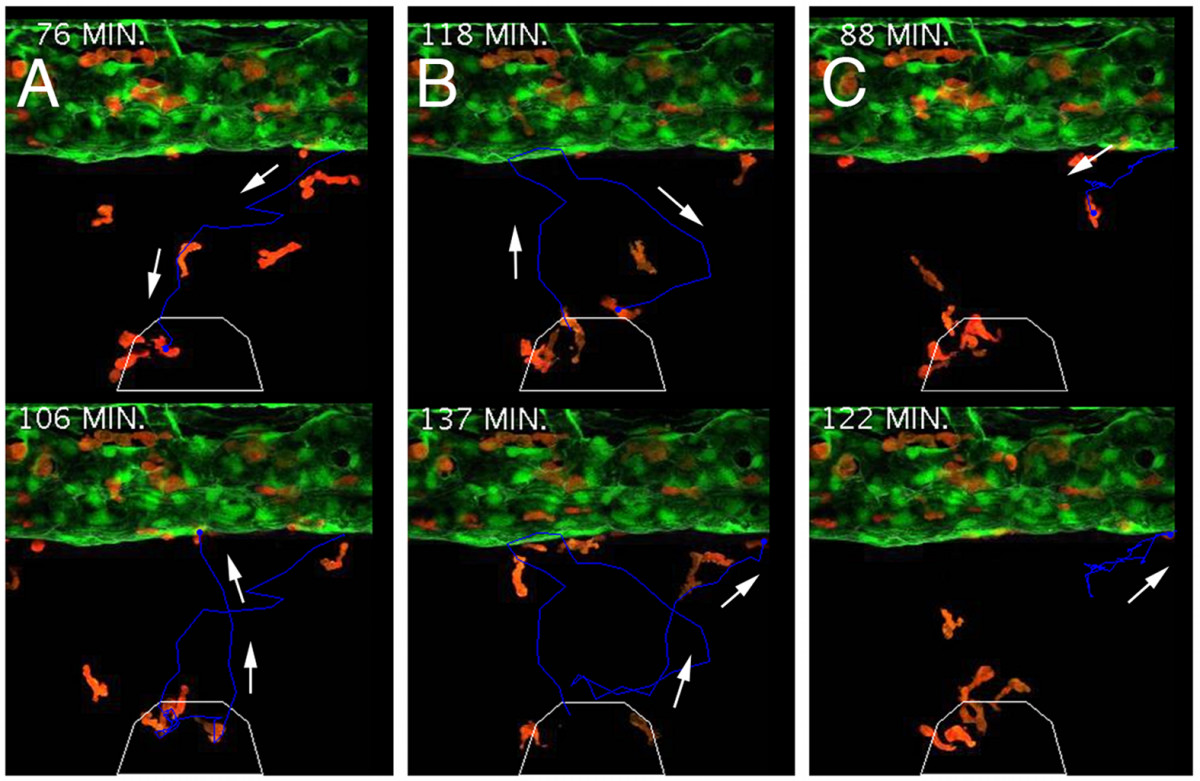
Figure Caption
Fig. 6 lysozyme C-expressing cells demonstrate varied responses to induced inflammation. (A-C) Cell tracking of individual responses, upper image in A and C displays cells at ventral-most location during migration, lower images display return migration of the same cell towards the caudal vein, arrows denote trajectory. Upper image in B displays a cell revisiting the injury and then retuning to the vasculature (lower image). White polygon demarcates injury boundaries.
Acknowledgments
This image is the copyrighted work of the attributed author or publisher, and
ZFIN has permission only to display this image to its users.
Additional permissions should be obtained from the applicable author or publisher of the image.
Full text @ BMC Dev. Biol.