
|
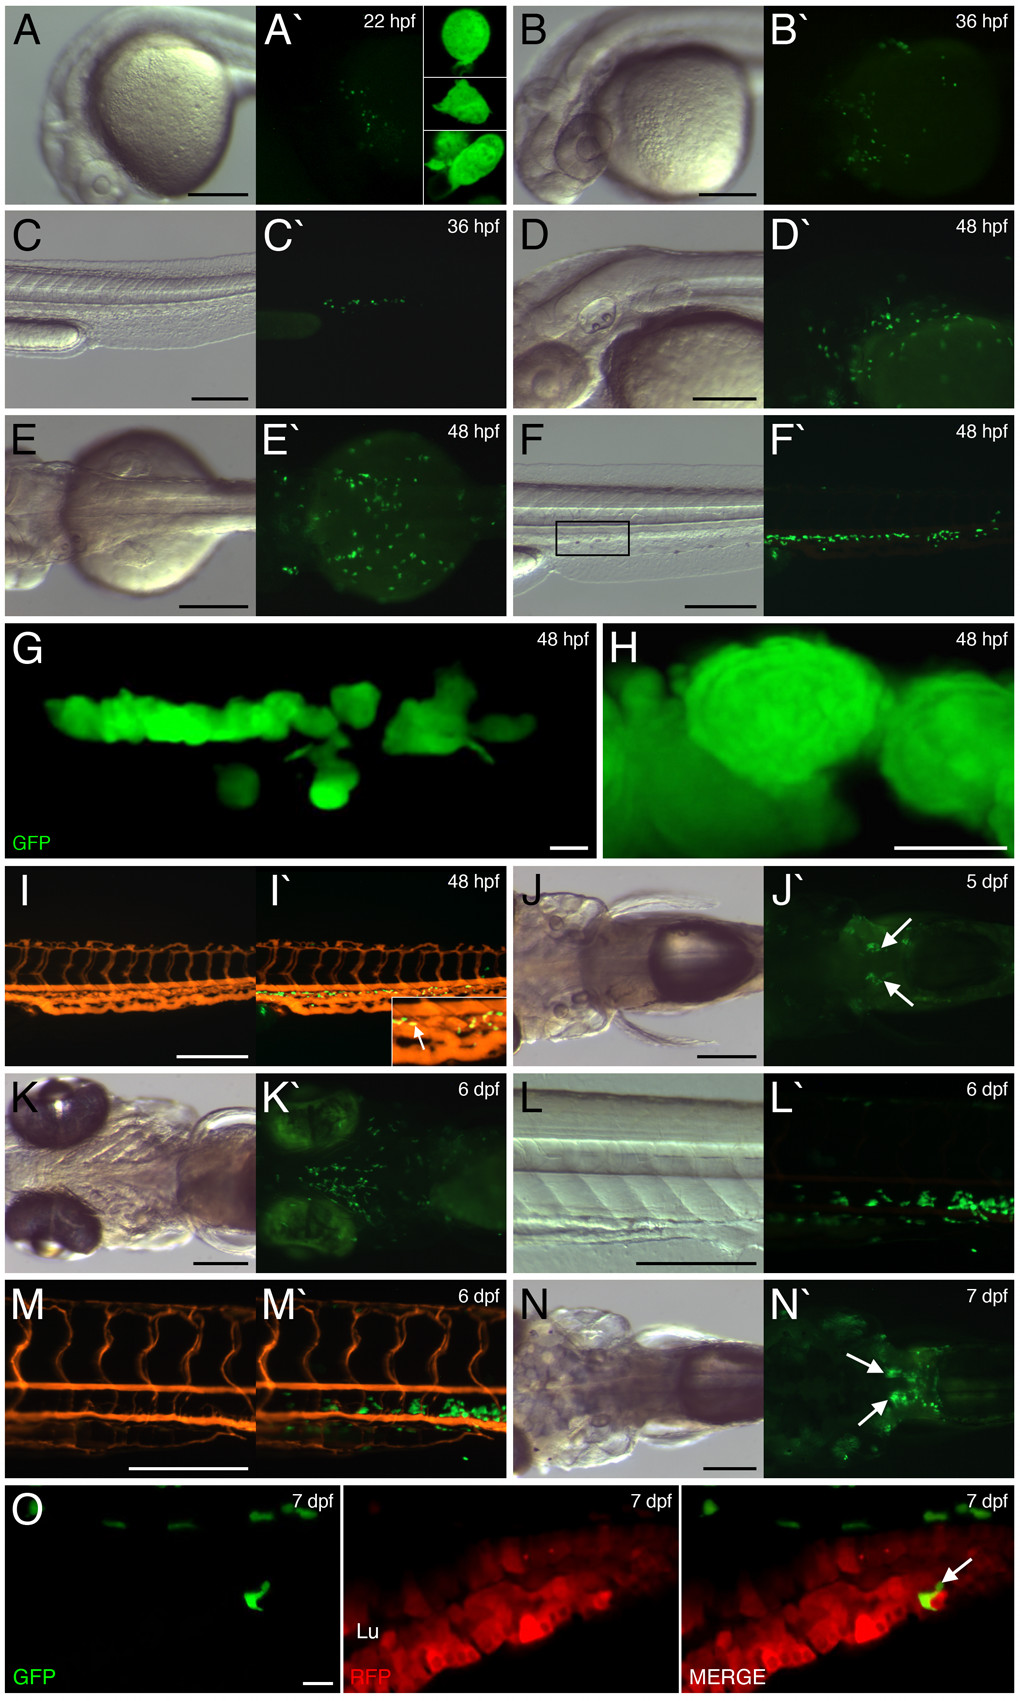
Fig. 1 EGFP expression within lysC::EGFP transgenic embryos and larvae. EGFP expression within 22 hpf (A), 36 hpf (B and C), 48 hpf (D-I), 5 dpf (J), 6 dpf (K-M) and 7 dpf (N and O) transgenic embryos/larvae. (A, B and D) Lateral views of developing head, anterior to left. (C, F-I, L and M) Lateral views of trunk/tail region, anterior to left. (E, J and N) Dorsal view of cranio-trunk region, anterior to left. (K) Ventral view of head region, anterior to left. (A-N and A′-N′) Bright field and dark field views, respectively. Insets in A′ and I′ represent magnified views of A′ and I′, respectively. (G) Summed Z stacks through aggregates of EGFP-labeled cells within posterior ICM region (marked by box in F). (H) Magnified view of cells in G. (I and M) Microangiography using red fluorescent microspheres within 48 hpf and 6 dpf transgenic larvae, respectively. (I′ and M′) Images merged with EGFP expression. Arrow in I′ denotes EGFP-labeled cell within caudal vascular plexus. Arrows in J′ and N′ denote expression within the pronephric glomerulus. (O) Summed Z stacks through mid-intestine of 7 dpf lysC::EGFP/I-FABP::RFP compound transgenic larva (anterior to left). Abbreviations: Lu, gut lumen. Scale bars: 200 μm in A-F and I-N; 10 μm in G and O; 5 μm in H.