
|
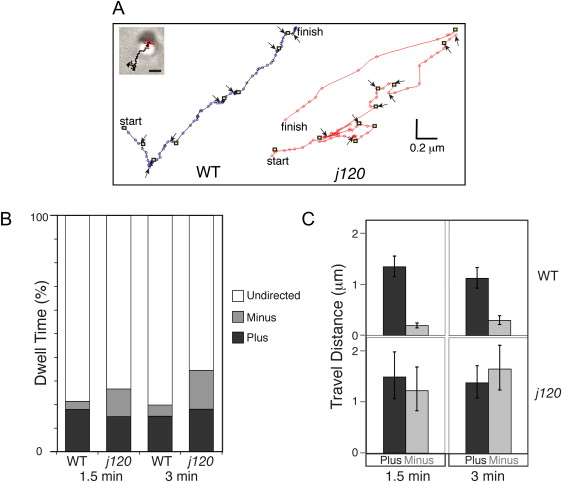
Fig. 3 Analysis of Individual Melanosome Movements during Dispersion (A) Melanosome tracks from wild-type and j120 mutant melanocytes undergoing global dispersion. Track duration is 30 s; lines connect the successive positions. Yellow squares mark the start of directed travel along microtubules; black arrows mark periods of pause or undirected movement. Shown in the inset are the DIC image and track overlay for the wild-type melanosome. (The scale bar represents 1 μm.) (B) Fraction of time melanosomes engage in the three motion states (minus-end, plus-end, or paused/undirected) during 30 s observation periods made 1.5 and 3 min after inducing dispersion. Each bar pools the data from all tracked melanosomes (Table 2) in the indicated category (e.g., wild-type, 1.5 min). The principal difference between the wild-type and mutant is that the mutant spends more time engaged in travel to the minus end. (C) Microtubule plus- and minus-end travel of wild-type and j120 melanosomes during 30 s observation intervals 1.5 and 3 min after initiating dispersion. Each bar represents the mean ± SEM over all tracked melanosomes. Travel distances are the products of the average run lengths and episode frequencies indicated in Table 2. Whereas for wild-type melanosomes plus-end travel exceeds minus-end travel, for mutant melanosomes, travel in the two directions is balanced.