
|
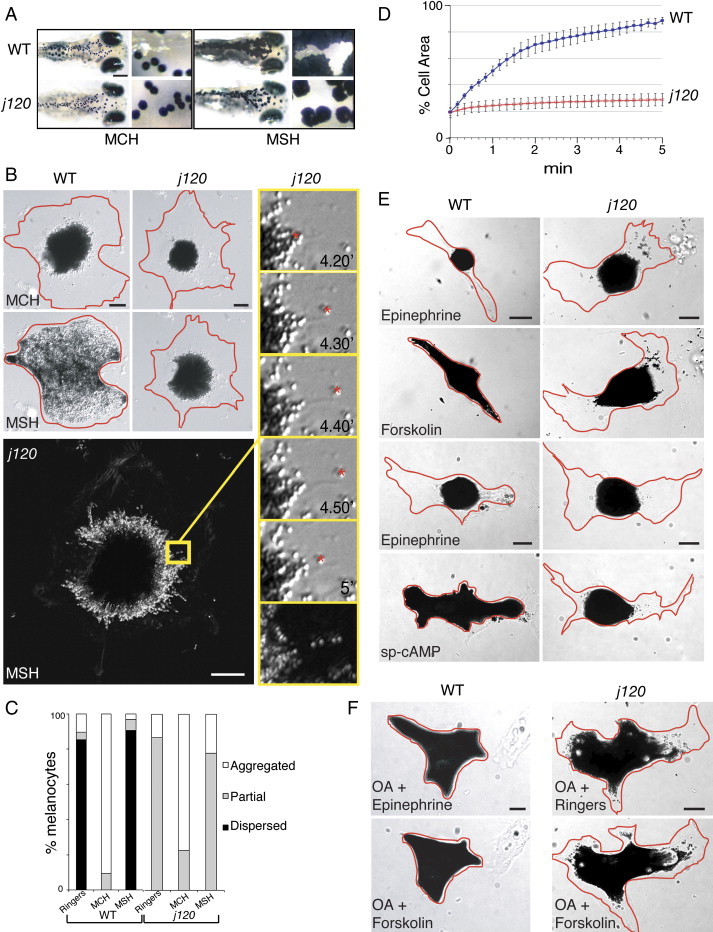
Fig. 1 Characterization of Melanosome Transport in Wild-Type and j120 Zebrafish Melanocytes (A) Aggregation and dispersion in wild-type and mutant five-day-old larvae. In response to MCH, pigment appears similarly aggregated in mutant and wild-type fish. In response to MSH, melanocytes within wild-type fish disperse their pigment fully, whereas melanocytes in j120 mutant fish do not. (The scale bar represents 200 μm in main images and 50 μm in insets.) (B) Aggregation and dispersion in cultured wild-type and j120 mutant melanocytes visualized by DIC microscopy. As shown in the top row, wild-type and mutant melanocytes fully aggregate their melanosomes after 5 min in MCH. Aggregation appears normal in the mutant melanocyte. As shown in the second row, exposure to MSH for 5 min elicits complete dispersion in wild-type but only partial dispersion in mutant melanocytes. The bottom and right-hand column contains a j120 mutant melanocyte showing that during dispersion its melanosomes load on microtubules and move bidirectionally. Digital images of this melanocyte were collected over a 5 min period after the initiation of dispersion by MSH. Each preceding frame was subtracted from each new frame so that a difference image could be created, and the stack of difference images was summed through the recording period. Thus, this figure reveals the sum of what has moved during the recording period. Linear trajectories of many individual melanosomes are evident as white “beads on a string.” One of these is within the area outlined in yellow. This area is shown at higher magnification at the bottom of the column of frames to the right. The upper five frames in the column show the direct images of the moving melanosome that produced the linear trajectory in the summed difference image. This melanosome moves bidirectionally (Scale bars represent 10 μm.). (C) Fraction of cultured wild-type and j120 mutant melanocytes that respond to hormones fully or partially. Melanocyte cultures were treated for 10 min with 0.5 μM MSH or 1 μM MCH. Partial dispersion (defined as melanosomes that spread from the aggregated state but did not completely fill the melanocyte within 10 min) or no dispersion (defined as melanosomes that remained aggregated after the dispersion stimulus) was evident in a minor fraction of wild-type melanocytes. j120 homozygous mutant melanocytes were never observed to fully disperse their melanosomes (n = 96 and 75 for wild-type and mutant, respectively). (D) Kinetics of global melanosome dispersion in cultured wild-type and mutant melanocytes. Wild-type and mutant melanocytes with melanosomes aggregated were stimulated to disperse with MSH or caffeine, and the percent of the projected cell area filled with melanosomes was measured at 10 s intervals. Data points are averages from five mutant and five wild-type melanocytes. (Error bars represent SEM.) (E) Images of cultured wild-type and mutant melanocytes 5 min after applying compounds that lower or elevate intracellular cAMP levels. As shown in the first and third rows, melanocytes were first exposed to 0.1 mM epinephrine for aggregation induction. As shown in the second and fourth rows, melanocytes were then exposed to forskolin (200 μM) or sp-cAMP (30 μM). Both elicit full melanosome dispersion in the wild-type but only slow partial dispersion in the mutant. (F) Response of cultured wild-type and j120 mutant melanocytes to melanosome aggregation- and dispersion-inducing drugs applied after overnight pretreatment with the phosphatase inhibitor okadaic acid (OA). The top left contains the positive control showing that OA inhibits the phosphatase responsible for aggregation. Pretreatment of wild-type cultures with 1 μM OA inhibits aggregation induced by epinephrine. As shown in the top and bottom right images, overnight pretreatment of j120 mutant melanocytes with 1 μM OA did not rescue partial dispersion, either in Ringers (upper) or after exposure to forskolin (lower). The small expansion of melanosomes in the j120 mutant melanocyte in (F) compared to those in (E) is a side effect of the overnight exposure to okadaic acid. The main point is that forskolin does not induce further expansion to the cell periphery, as it does in wild-type melanocytes. As shown in the bottom left panel, forskolin induces full dispersion in wild-type melanocytes pre-treated with 1 μM OA. (Scale bars represent 10 μm.)