
IMAGE
Fig. S2
Image
|
Figure Caption
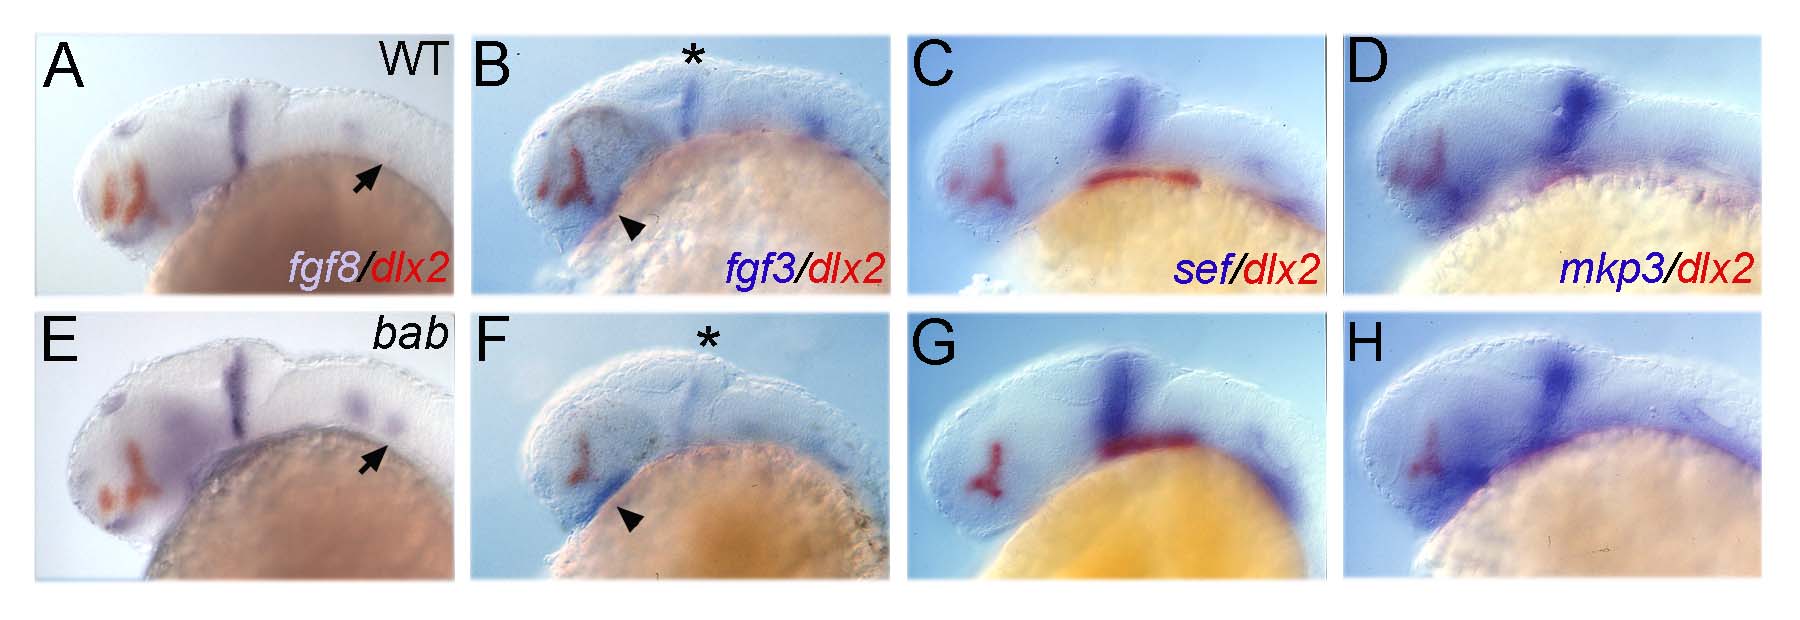
Fig. S2 bab displays tissue-specific up- and down-regulation of Fgf pathway transcripts at 24 hpf. All panels show lateral views of whole-mount in situ hybridizations of 24 hpf WT (A-D) or bab (E-H) embryos for fgf8 (A,E), fgf3 (B,F), sef (C,G), and mkp3 (D,H) in blue and dlx2 in red (for genotyping purposes). Expression in the diencephalon (arrowheads), posterior otic capsule (arrows), and MHB (*) is denoted for the corresponding transcripts.
Figure Data
Acknowledgments
This image is the copyrighted work of the attributed author or publisher, and
ZFIN has permission only to display this image to its users.
Additional permissions should be obtained from the applicable author or publisher of the image.
Full text @ Dev. Dyn.