
Image
|
Figure Caption
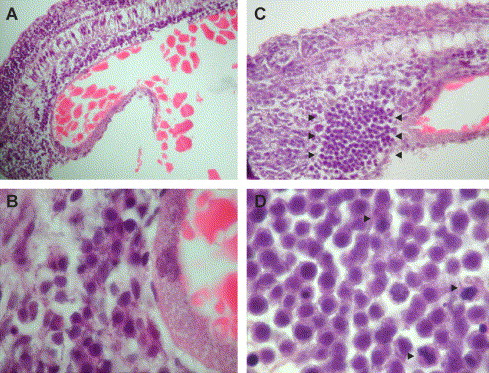
Fig. 2 Hematoxylin and eosin sectioning of WT (A, B) and ChdMO embryos (C, D) at low (A, C) and high-power (B, D) magnification at 24 hpf. In WT embryos, the ICM is only 3–5 cell thick posterior to the yolk extension. The ChdMO embryos had expanded ICM (arrowheads in panel C), which contained a monotonous population of cells with regular and round nuclei and high nuclei to cytoplasm (N/C) ratio. Mitotic figures are easily identified (arrowheads in panel D).
Acknowledgments
This image is the copyrighted work of the attributed author or publisher, and
ZFIN has permission only to display this image to its users.
Additional permissions should be obtained from the applicable author or publisher of the image.
Reprinted from Developmental Biology, 277(1), Leung, A.Y., Mendenhall, E.M., Kwan, T.T., Liang, R., Eckfeldt, C., Chen, E., Hammerschmidt, M., Grindley, S., Ekker, S.C., and Verfaillie, C.M., Characterization of expanded intermediate cell mass in zebrafish chordin morphant embryos, 235-254, Copyright (2005) with permission from Elsevier. Full text @ Dev. Biol.