
|
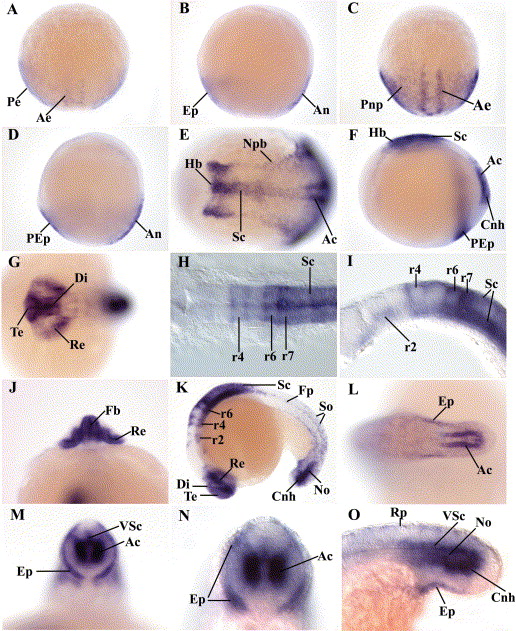
Fig. 3 Spatio-temporal distribution of zebrafish crabp2a mRNA during early embryonic development. Whole mount in situ hybridization showing zebrafish crabp2a mRNA in the embryos during 80% epiboly at approximately 9 hpf (A, B), then during late gastrula at approximately 10 hpf (C, D), during early and middle somitogenesis at approximately 11 hpf (E, F) and at approximately 17 hpf (G–O). (A, C) Dorsal view, anterior is to the top; (B, D) side view, anterior is to the top; (E, G, H, L) dorsal view, anterior is to the left; (F, K, I, O) side view, anterior is to the left; (J) frontal view showing forebrain (Fb) and retina (Re), dorsal is to top; (M, N) transverse, dorsal is to top. The crabp2a mRNA expression in adaxial cells (Ac); adaxial epiblast (Ae); adaxial neuroectoderm (An); chordo-neural hinge (Cnh); diencephalon (Di); epidermis (Ep); floor plate (Fp); hindbrain (Hb); notochord (No); neural plate border (Npb); posterior epiblast (Pe); posterior epidermis (PEp); posterior neural plate (Pnp); rhombomeres (r) 2, 4, 6 and 7; roof plate (Rp); spinal cord (Sc); somites (So); telencephalon (Te) and ventral spinal cord (VSo) is indicated.
Reprinted from Gene expression patterns : GEP, 5(3), Sharma, M.K., Saxena, V., Liu, R.Z., Thisse, C., Thisse, B., Denovan-Wright, E.M., and Wright, J.M., Differential expression of the duplicated cellular retinoic acid-binding protein 2 genes (crabp2a and crabp2b) during zebrafish embryonic development, 371-379, Copyright (2005) with permission from Elsevier. Full text @ Gene Expr. Patterns