
|
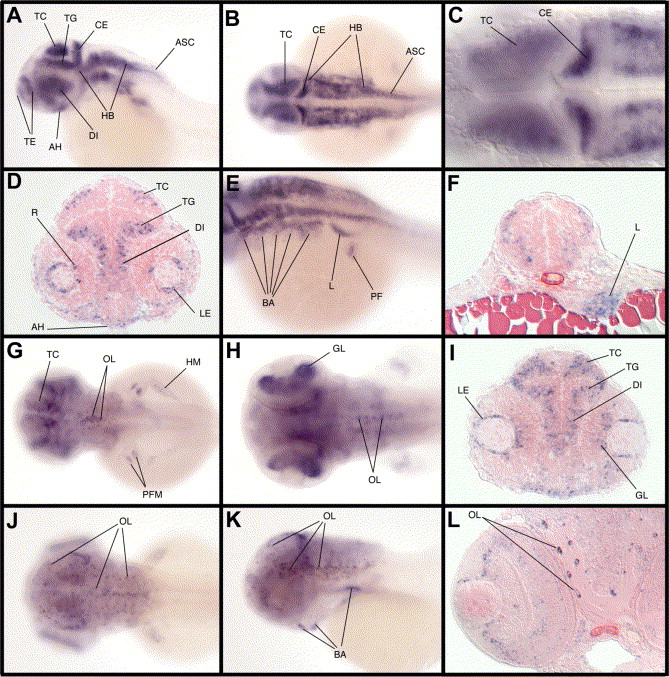
Fig. 5 Expression of traf4a at 40, 48 and 60 hpf. (A–C) At 40 hpf, traf4a expression is detected in the telencephalon (TE), the tectum (TC), the tegmentum (TG), the cerebellum (CE), the diencephalon (DI), the hindbrain (HB), the adenohypophyse (AH) and the anterior spinal cord (ASC). (D) In the eye, traf4a is expressed in the lens (LE) and in cells of the retina (R) close to the lens. (E,F) Additional expression of traf4a is observed in the liver (L) and in the pectoral fins (PF). (G–I) At 48 hpf, expression of traf4a in the brain is still detected in the telencephalon (TE), the tegmentum (TG), and the diencephalon (DI) with strong labeling in oligodendrocytes (OL). A staining is observed in the pectoral fin muscles (PFM), the hypaxial muscles (HM). In the eye, expression is observed in the lens (LE) and in the ganglion cell layer (GL). (J–L) At 60 hpf, expression of traf4a is mainly observed in the oligodendrocytes (OL) and the branchial arches (BA). (A,K) lateral views, (B,C,G,H,J) dorsal views, (E) oblique view, (D,F,I,L) histological transverse sections, (C) optical cross section. For dorsal, lateral and oblique view anterior is to the left and for transverse sections dorsal is up.
Reprinted from Gene expression patterns : GEP, 5(4), Kedinger, V., Alpy, F., Tomasetto, C., Thisse, C., Thisse, B., and Rio, M.C., Spatial and temporal distribution of the traf4 genes during zebrafish development, 545-552, Copyright (2005) with permission from Elsevier. Full text @ Gene Expr. Patterns