
|
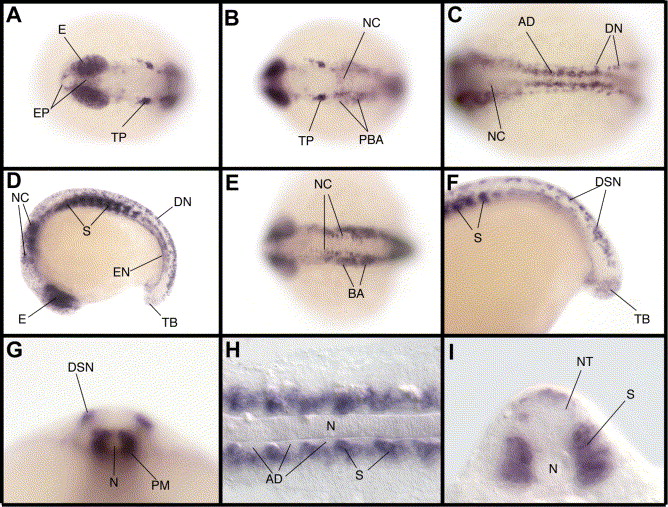
Fig. 3 Expression of traf4a at midsomitogenesis. (A–C) At the 10 somite stage, traf4a is seen in the eyes (E), the epidermis (EP), the trigeminal placode (TP), the presumptive branchial arches (PBA), the anterior trunkal neural crest (NC), the adaxial cells (AD) and the dorsal neurons (DN). (D,E) At the 15 somite stage, in addition to the expression in the eye, the anterior trunkal neural crest and the dorsal neurons, an expression of traf4a is detected in the endoderm (EN), the somites (S), the tail bud (TB) and the branchial arches (BA). (F) Focus on the tail of the embryo seen in (D) showing traf4a staining in the tail bud, in the somites and in the dorsal spinal cord neurons (DSN). (G) An optical section at the trunk level shows expression of traf4a in the dorsal spinal cord neurons and in the paraxial mesoderm (PM). (H) In the paraxial mesoderm, traf4a expression encompasses the proximal part of the somite (S) but is excluded from the adaxial cells (AD) as confirmed in (I) on a transverse thick section. (A–C,E) dorsal views, (D,F) lateral views. In each panel, anterior is to the left. (G) optical section, (H) dorsal view of a flat mount after removal of the yolk, (I) thick section. N, notochord; NT, neural tube.
Reprinted from Gene expression patterns : GEP, 5(4), Kedinger, V., Alpy, F., Tomasetto, C., Thisse, C., Thisse, B., and Rio, M.C., Spatial and temporal distribution of the traf4 genes during zebrafish development, 545-552, Copyright (2005) with permission from Elsevier. Full text @ Gene Expr. Patterns