
|
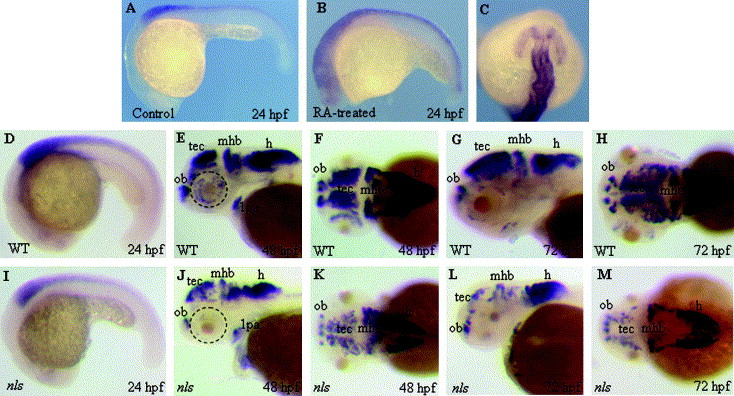
Fig. 3 Expression of tsh1 is affected by retinoic acid signaling. (A–C) Expression of tsh1 expression in mock (A) and RA (B–C) treated embryos. (C) A dorsal view (anterior to the top) of the embryo in (B). (D, E, F, G and H) Lateral or dorsal view of tsh1 expression in wild-type and (I, J, K, L and M) neckless (nls) mutants. At 24 hpf, tsh1 expression in the spinal cord is markedly reduced in the nls mutant embryo (I) compared to wild-type siblings (D). Between 48 and 72 hpf, nls mutants (J, K, L and M) exhibit reduced tsh1 expression in the tectum, eyes, the midbrain–hindbrain boundary and the hindbrain. Abbreviations: mhb, mid–hindbrain; tec, tectum opticum; t, telencephalon; ob, olfactory bulb; h, hindbrain.
Reprinted from Gene expression patterns : GEP, 7(3), Wang, H., Lee, E.M., Sperber, S.M., Lin, S., Ekker, M., and Long, Q., Isolation and expression of zebrafish zinc-finger transcription factor gene tsh1, 318-322, Copyright (2007) with permission from Elsevier. Full text @ Gene Expr. Patterns