
|
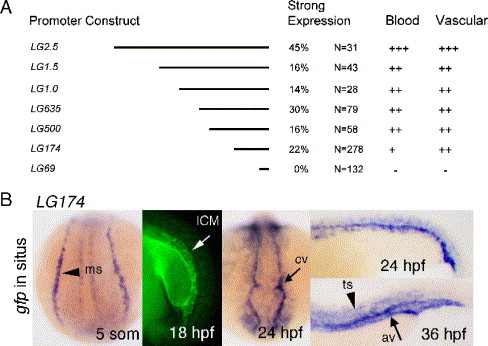
Fig. 4 Deletion analysis identifies a compact promoter that drives hematopoietic and vascular expression. (A) The percentages of “strong expressers” (defined as >20 fluorescent cells in the ICM at 24–30 hpf) and relative levels of blood or vascular expression at 30 hpf are shown. (C) The developmental expression of the LG174 transgenic is shown at 5 somites, 18, 24, and 36 hpf. LG174 drives expression in the mesodermal stripe (ms, arrowhead), vascular cells (black arrows point to cv, cranial vessels; av, axial vessels), hematopoietic cells (white arrow, ICM), and trunk somites (black arrowhead, ts).
Reprinted from Developmental Biology, 281(2), Zhu, H., Traver, D., Davidson, A.J., Dibiase, A., Thisse, C., Thisse, B., Nimer, S., and Zon, L.I., Regulation of the lmo2 promoter during hematopoietic and vascular development in zebrafish, 256-269, Copyright (2005) with permission from Elsevier. Full text @ Dev. Biol.