
Fig. 4
- ID
- ZDB-IMAGE-070925-85
- Genes
- Publication
- Gulati-Leekha et al., 2006 - A reporter-assisted mutagenesis screen using α1-tubulin-GFP transgenic zebrafish uncovers missteps during neuronal development and axonogenesis
- All Figures
- Figures for Gulati-Leekha et al., 2006
|
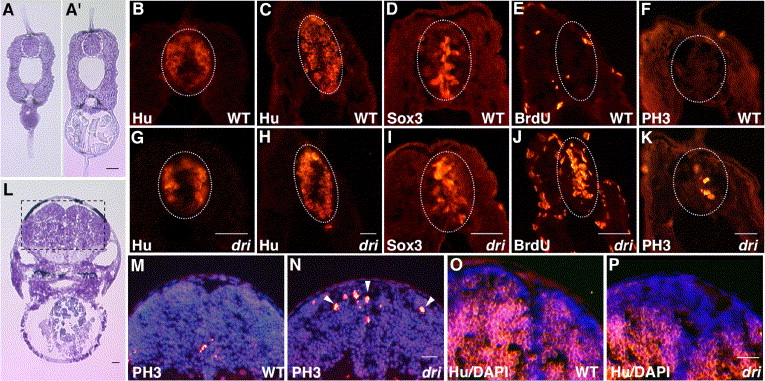
Fig. 4 Mutation in drishti biases the neuronal composition towards proliferating progenitors at the expense of postmitotic cells. Panels A and A′ indicate the anteroposterior level of the embryo at which spinal cord analysis was carried out. HuC/D immunostaining of caudal (A, B, G) and mid-trunk (A′, C, H) transverse spinal cord sections shows a reduction in Hu-positive neurons at 2 dpf. Increase in Sox3 (D, I), BrdU (E, J), and PH3 (F, K) immunostaining in similar sections (mid-trunk level, A′) demonstrates that the self-renewing neural population in mutants is enriched by an enhanced number of cycling cells. Note that whereas the majority of increase in BrdU incorporation is restricted to neural cells, some evidence of higher staining is also observed in the dri surface epithelium (J). Representative transverse sections of the hind-brain ventricular region (outlined area, L) show a concomitant enrichment of PH3-positive cells (arrowheads) in dri mutants [panels M and N show DAPI-stained images (blue) overlaid with the corresponding PH3 immunostaining (red)]. Hu (red) and counter-stained DAPI (blue) merged images in O and P highlight the diminished Hu-positive domain surrounding the HB ventricle in dri. Ellipses mark the spinal cord in panels A–K. Scale bars: 25 μm in all panels.
Reprinted from Developmental Biology, 296(1), Gulati-Leekha, A., and Goldman, D., A reporter-assisted mutagenesis screen using α1-tubulin-GFP transgenic zebrafish uncovers missteps during neuronal development and axonogenesis, 29-47, Copyright (2006) with permission from Elsevier. Full text @ Dev. Biol.