
Image
|
Figure Caption
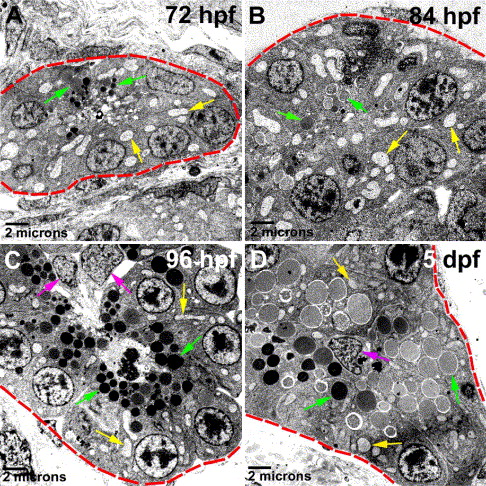
Fig. 5 Acinar cell ultrastructure. (A–D) Transmission electron micrographs of pancreatic acini (outlined by red dashed lines). Progressive maturation of acinar cells is evident between 72 hpf and 5 dpf as determined by the cell polarity, number and size of zymogen granules (green arrows) and the amount of mitochondria (yellow arrows) and rough endoplasmic reticulum. Centroacinar cells are indicated by pink arrows.
Acknowledgments
This image is the copyrighted work of the attributed author or publisher, and
ZFIN has permission only to display this image to its users.
Additional permissions should be obtained from the applicable author or publisher of the image.
Reprinted from Developmental Biology, 284(1), Yee, N.S., Lorent, K., and Pack, M., Exocrine pancreas development in zebrafish, 84-101, Copyright (2005) with permission from Elsevier. Full text @ Dev. Biol.