
|
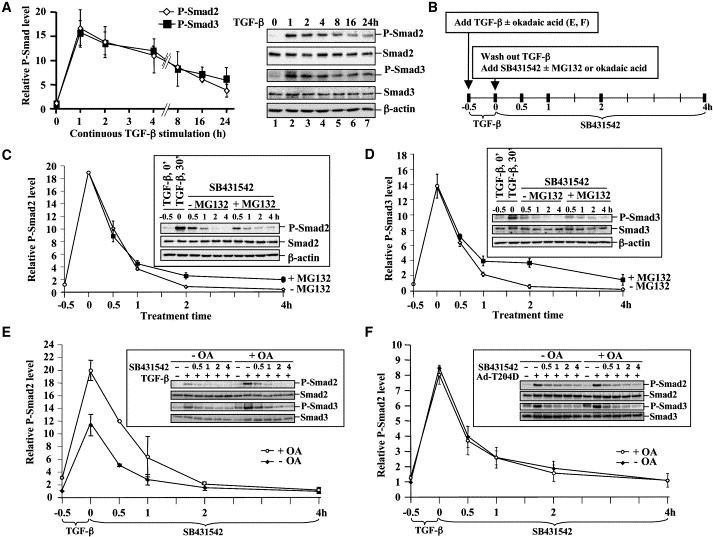
Fig. 1 Dynamic Phosphorylation and Dephosphorylation of Smad2/3 (A) Time course of Smad2/3 phosphorylation. HaCaT cells were treated with 2 ng/ml of TGFβ1 for the indicated time periods. P-Smad2/3 and total Smad2/3 were analyzed by Western blotting. Left: Line graph representing three independent experiments. Intensity of P-Smad2/3 relative to total Smad2/3 from each experiment was quantified by NIH Image software. Values are the mean of at least two independent experiments; error bars are ± standard deviation of the mean. Right: A representative Western blot. (B) A schematic representation of treatments designed for (C)–(F). (C) Analysis of Smad2 dephosphorylation. HaCaT cells were treated with 2 ng/ml of TGFβ1 for 30 min, followed by TGFβ washout and simultaneous addition of 5 μM SB431542 and 20 μM MG-132. Graph shows relative P-Smad2 level (over total Smad2) from three independent experiments, with values and error bars representing mean and standard deviation. The insert is one representative experiment. (D) Experiments equivalent to (C) analyzing Smad3 dephosphorylation in HaCaT cells. (E) Effect of okadaic acid (OA) on TGFβ-dependent phosphorylation of Smad2/3. HaCaT cells were treated with TGFβ1 and SB431542 as in (C); in a separate group of cells, 5 nM OA was added 3.5 hr before TGFβ and continued with TGFβ and SB431542 treatment (for a total of 8 hr). Graphical analysis of relative P-Smad2/3 levels is presented here (line graph) and in Figure S2A. Values are mean of three independent experiments; error bars are ± standard deviation of the mean. (F) Effect of OA on TβRI(T204D)-induced phosphorylation of Smad2/3. HaCaT cells were infected with AdTβRI(T204D) adenoviruses at moi of 200. After 48 hr, cells were treated with 5 μM SB431542. Five nanomolar OA was added 3.5 hr before SB431542 addition and remained with SB431542. Graphical analysis of relative P-Smad2/3 levels is presented here (line graph) and in Figure S2B. Values and error bars are mean and standard deviation of three independent experiments.
Reprinted from Cell, 125(5), Lin, X., Duan, X., Liang, Y.Y., Su, Y., Wrighton, K.H., Long, J., Hu, M., Davis, C.M., Wang, J., Brunicardi, F.C., Shi, Y., Chen, Y.G., Meng, A., and Feng, X.H., PPM1A functions as a Smad phosphatase to terminate TGFbeta signaling, 915-928, Copyright (2006) with permission from Elsevier. Full text @ Cell