
|
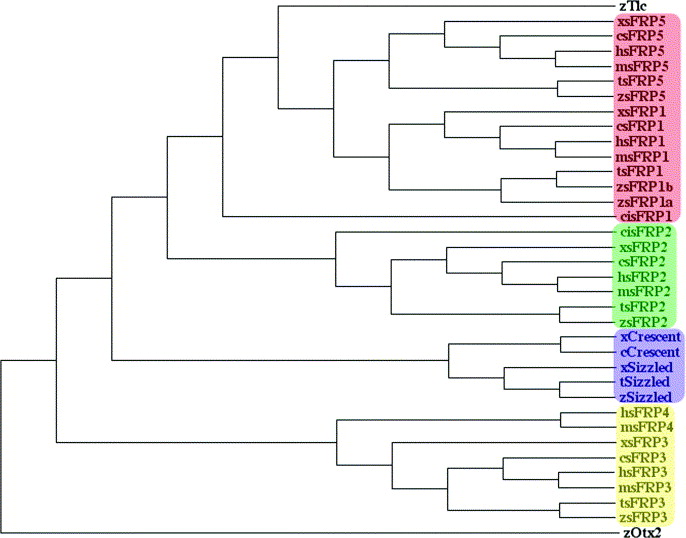
Fig. 1 Phylogenic distribution of sFRPs. From an alignment of sFRPs performed with ClustalW (Thompson et al., 1994), a consensus phylogenetic tree was constructed using the Maximum Parsimony method included in the software Phylowin (Galtier et al., 1996). In terms of amino-acid sequence, sFRP members could be subdivided in four subgroups: sFRP1/5 (red box), sFRP2 (green box), Crescent/Sizzled (blue box) and sFRP3/4 (yellow box). Interestingly, Tlc has not been found clustered in one of these subgroups on the basis of sequence similarity. The zebrafish protein Otx2 is used as an outgroup sequence. Species abbreviations: c, chick (G. gallus); ci, C. intestinalis; h, human (H. sapiens); m, mouse (M. musculus); t, pufferfish (T. nigroviridis); x, xenope (X. laevis); z, zebrafish (D. rerio).
Reprinted from Gene expression patterns : GEP, 6(8), Tendeng, C., and Houart, C., Cloning and embryonic expression of five distinct sfrp genes in the zebrafish Danio rerio, 761-771, Copyright (2006) with permission from Elsevier. Full text @ Gene Expr. Patterns