
|
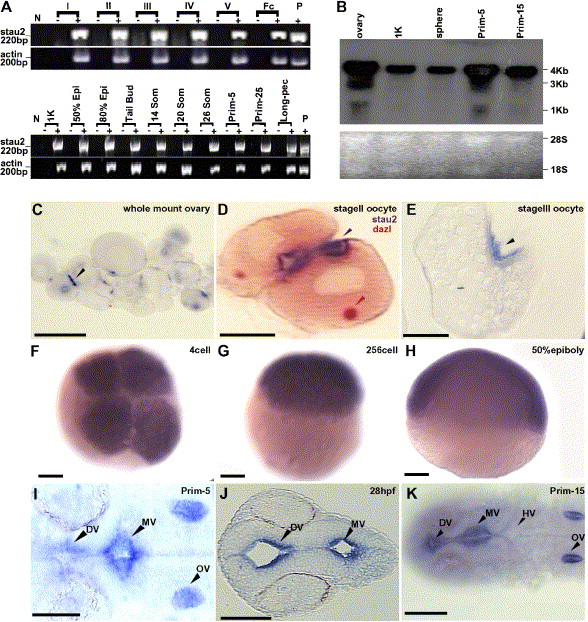
Fig. 2 Expression of stau2 in oocytes and embryos. (A) RT-PCR analysis of stau2 expression in comparison to actin in oocytes (top panel) and embryos (bottom panel) (stages indicated above lanes). Abbreviations: fc, follicle cells; epi, epiboly; som, somites; N, no template control; P, plasmid control; − indicates RT-control for each stage. (B) Northern Blot analysis of stau2 expression. A predominant 4 kb transcript is detected in oocytes and embryos. In addition, a shorter 3 kb transcript is seen in oocytes and prim-5 embryos. Lower panel, Ethidium bromide stained 28S and 18S rRNA loading controls. (C–K) Spatiotemporal expression of stau2 by whole mount (C, F–I, K) or section (D, E, J) in situ hybridizations on oocytes (C–E) and embryos (F–K); black arrowheads, stau2; red arrowhead, dazl; stau2 is expressed in 2–3 cortical patches in oocytes (C–E), is uniform in early cleavage stage embryos (F–H), and is localized in embryos from late segmentation stages (I–K). Abbreviations: DV, diencephalic ventricle; MV, midbrain ventricle; HV, hindbrain ventricle; OV, otic vesicle. Scale bars, 100 μm.
Reprinted from Developmental Biology, 292(2), Ramasamy, S., Wang, H., Quach, H.N., and Sampath, K., Zebrafish Staufen1 and Staufen2 are required for the survival and migration of primordial germ cells, 393-406, Copyright (2006) with permission from Elsevier. Full text @ Dev. Biol.