
|
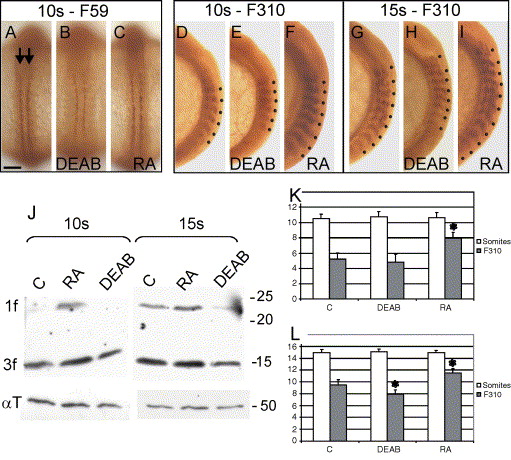
Fig. 5 Differential response of slow- and fast-muscle differentiation depending on developing stage. 10- and 15-somite stage embryos were stained for myosin expression. At stages analysed, F59 antibody is specific for slow-myosin, F310 is specific for fast-myosin. (A–C) Dorsal views, anterior to the top, (D–I) lateral views, anterior to the top. (A) At 10-somite stage, slow-myosin is detected in two rows of adaxial cells (arrows). (B–C) Slow-myosin expression is decreased in DEAB-treated embryos (B), and similar to wild-type in RA-treated embryos (C). (D) In 10-somite stage, fast-muscle differentiation begins in anterior somites (dots indicate somites counted as positive in panel K). (E) Fast myosin expression is unchanged in DEAB-treated embryos. (F) Fast-myosin expression is increased in RA-treated embryos as well as the number of F310-positive somites (dots). (G–I) The same observation can be made at 15-somite stage for all three conditions. (J) Western blot analysis of fast myosin expression with antibody F310 revealed the presence of two bands corresponding to Myosin light chain (MLC), MLC3f (3f; 15 kDa) and MLC1f (1f; 22 kDa). At 10-somite stage, MLC1f is barely visible in control lane (lane C) while it is strongly expressed in RA-treated (RA lane). MLC3f is decreased in DEAB lane and increased in RA lane. At 15-somite, MLC1f can now be seen in DEAB lane albeit weaker than in control lane, while it is increased in RA lane compared to control. α-Tubulin (αT) has been used to compare loading in each lane. (K–L) Comparison of F310-positive somites (grey histogram) according to the number of somites (white histogram) at 10-somite (K) and 15-somite stage (L). DEAB treatment produces a significant reduction of F310-positive somites at the 15-somite stage while RA produces a significant increase at both 10- and 15-somite stages compared to control. The standard error is indicated. * Indicates number significantly different from wild-type (PKW < 0.001). Scale bar: in panel A, 100 μm for panels A–I.
Reprinted from Developmental Biology, 289(1), Hamade, A., Deries, M., Begemann, G., Bally-Cuif, L., Genet, C., Sabatier, F., Bonnieu, A., and Cousin, X., Retinoic acid activates myogenesis in vivo through Fgf8 signalling, 127-140, Copyright (2006) with permission from Elsevier. Full text @ Dev. Biol.