
|
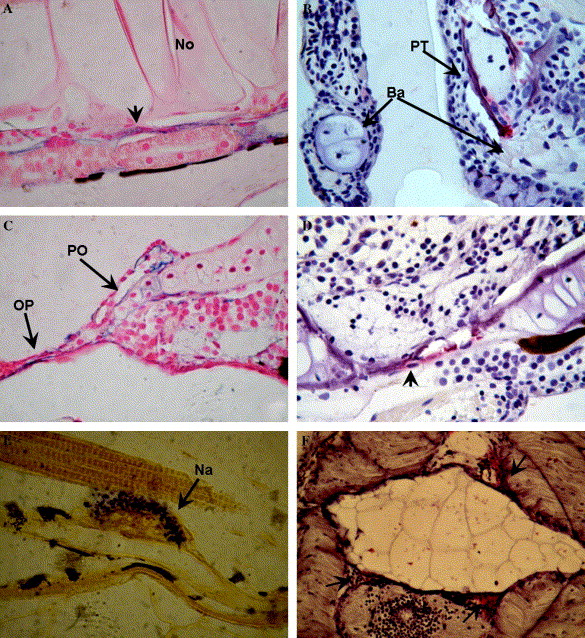
Fig. 2 Alkaline phosphatase and TRAP activity in the developing zebrafish (A-D) and sole (E-F) skeleton. (A) Alkaline phosphatase activity (in blue) detected in the forming vertebra (arrow) surrounding the notochord (No) of a zebrafish larva at 13 dpf (1000x). (B) Tartrate resistant acid phosphatase (TRAP) activity (in red) is detected in developing, partially calcified, branchial arches (BA) and pharyngeal teeth (PT) of a zebrafish at 17 dpf (1000x). (C) Alkaline phosphatase activity in the calcifying preopercular cartilage (PO) and in the intramembranous opercular bone (OP) (1000x) in zebrafish larvae at 17 dpf. (D) TRAP activity in the intramembranously forming skull bones (1000x) of zebrafish at 26 dpf. A cell surrounded by TRAP activity is located in a resorption site (arrow). (E) Alkaline phosphatase activity (blue) is detected in 17 dpf Senegal sole in the forming neural arches (1000x). (F) TRAP activity (red) is detected surrounding the vertebra, arches, and spines.
Reprinted from Gene expression patterns : GEP, 6(6), Gavaia, P.J., Simes, D.C., Ortiz-Delgado, J.B., Viegas, C.S., Pinto, J.P., Kelsh, R.N., Sarasquete, M.C., and Cancela, M.L., Osteocalcin and matrix Gla protein in zebrafish (Danio rerio) and Senegal sole (Solea senegalensis): Comparative gene and protein expression during larval development through adulthood, 637-652, Copyright (2006) with permission from Elsevier. Full text @ Gene Expr. Patterns