
|
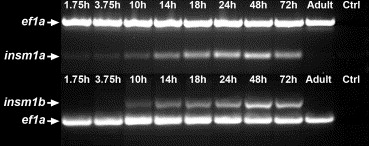
Fig. 2 Reverse transcriptase-PCR analysis of zebrafish insm1a and insm1b during development. Two hundred and fifty nanograms total RNA was used per reaction. Time listed above each lane indicates embryonic age post-fertilization at which the RNA was extracted. Zebrafish neurogenesis begins at tailbud stages (9 hpf) and reaches maximal levels between 24 and 72 hpf, a pattern that is precisely followed by both insm1 transcripts. Neither transcript is expressed in adult tissues, which is consistent with mammalian expression data. The final lane is a no RNA control. Note that insm1a transcripts appear to be maternally inherited as zygotic transcription does not begin until 3 hpf, while insm1b is not.
Reprinted from Gene expression patterns : GEP, 6(7), Lukowski, C.M., Ritzel, R.G., and Waskiewicz, A.J., Expression of two insm1-like genes in the developing zebrafish nervous system, 711-718, Copyright (2006) with permission from Elsevier. Full text @ Gene Expr. Patterns