
Image
|
Figure Caption
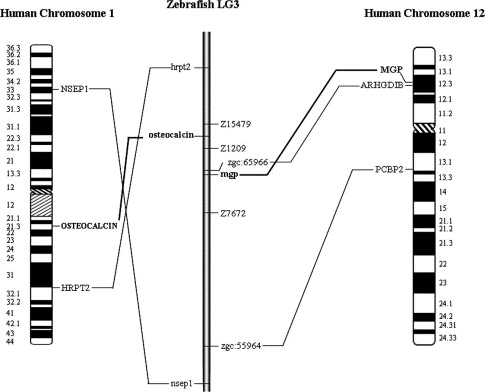
Fig. 7 Chromosomal localization of zebrafish mgp and bgp using the LN54 panel. mgp and bgp map on LG3, at 9.54cR from Z1209 and 3.87cR from Z15479 markers, respectively. Some synteny was observed between zebrafish LG3 and human chromosomes 1 and 12, as indicated by lines between syntenic homologues.
Acknowledgments
This image is the copyrighted work of the attributed author or publisher, and
ZFIN has permission only to display this image to its users.
Additional permissions should be obtained from the applicable author or publisher of the image.
Reprinted from Gene expression patterns : GEP, 6(6), Gavaia, P.J., Simes, D.C., Ortiz-Delgado, J.B., Viegas, C.S., Pinto, J.P., Kelsh, R.N., Sarasquete, M.C., and Cancela, M.L., Osteocalcin and matrix Gla protein in zebrafish (Danio rerio) and Senegal sole (Solea senegalensis): Comparative gene and protein expression during larval development through adulthood, 637-652, Copyright (2006) with permission from Elsevier. Full text @ Gene Expr. Patterns