
|
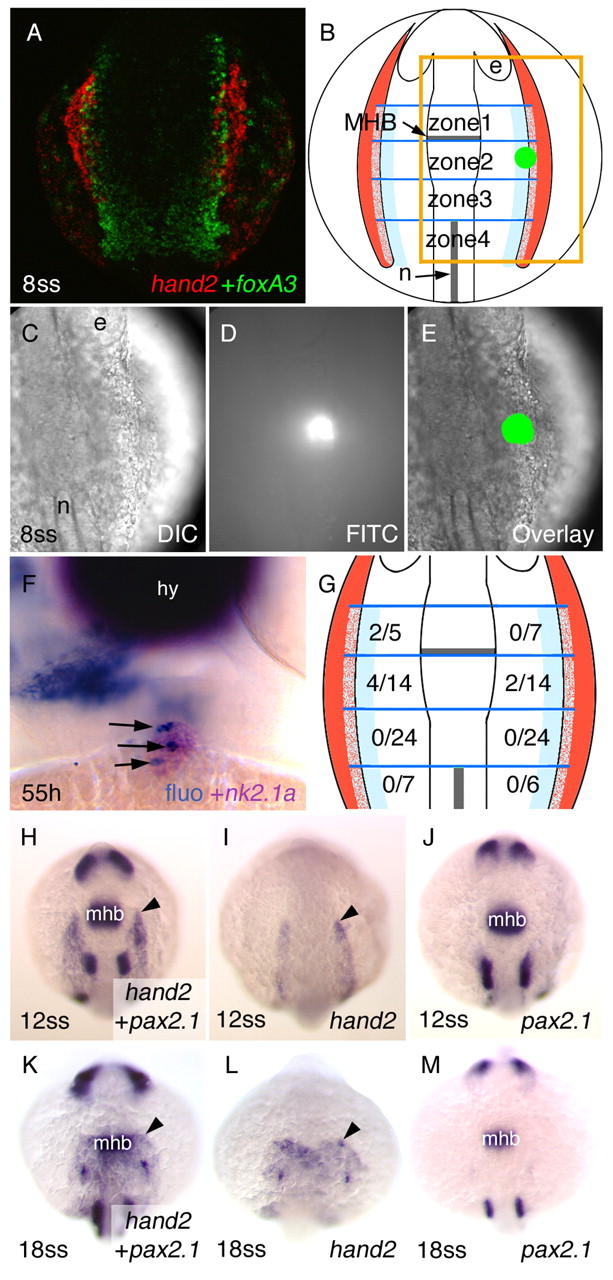
Fig. 3 Fate mapping of thyroid precursor cells reveals their close association with the lateral plate mesoderm. (A) Double fluorescence in situ hybridisation of han (hand2; red) and the endoderm marker foxa3 (green). Dorsal view, anterior is up. (B) Subdivision of the region of interest (light blue: potential overlap between lateral plate mesoderm and endoderm) into four zones according to landmarks. Red: lateral plate mesoderm; green, see D,E. The orange square corresponds to the section shown in C-E. (C-E) Example of photoactivation: (C) Nomarski view, (D) after photoactivation, (E) overlay. (F) Example of an embryo (frontal view) in which photoactivated cells (fluorescein, dark blue, arrows) are detectable in the thyroid primordium (pink). Photoactivated cells are also present in pharyngeal cells further away from the midline. (G) Numbers of embryos in which photoactivated cells contributed to the thyroid. Given are numbers of such embryos/total numbers of uncaging experiments at the corresponding anteroposterior level. Compare with B. Notice that only photoactivation in zone 1 and 2 resulted in contributions to the thyroid. (H-M) Comparison of hand2 expression with the midbrain-hindbrain boundary (MHB) marker pax2.1. Arrowheads point to the anterior border of hand2 expression. e, eye; hy, hypothalamus; mhb, midbrain-hindbrain boundary; n, notochord; ss, somite stage.