
|
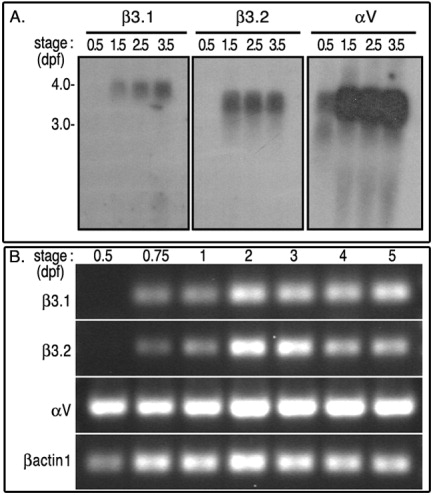
Fig. 1 mRNA expression profiles of αV, β3.1, and β3.2. A: Approximately 15 μgr total RNA extracted from 0.5, 1.5, 2.5, and 3.5 dpf zebrafish larva, was resolved in denaturing agarose gel, and processed for Northern blot analysis. B: The expression of these integrins analyzed by semi-quantitative RT-PCR. Total RNAs were extracted from 3-5 somite (0.5 dpf), 16-18 somites (0.75 dpf), 1 dpf, 2 dpf embryos, and later from 3 dpf, 4 dpf, and 5.5 dpf swimming larva. RT-PCR reactions were done with sequence-specific primers against αV (172 bp), β3.1 (312 bp), and β3.2 (385 bp). RT-PCR reactions were also monitored with amplification of zebrafish βactin1 fragment (172 bp), which was used as a positive loading control.