
Image
|
Figure Caption
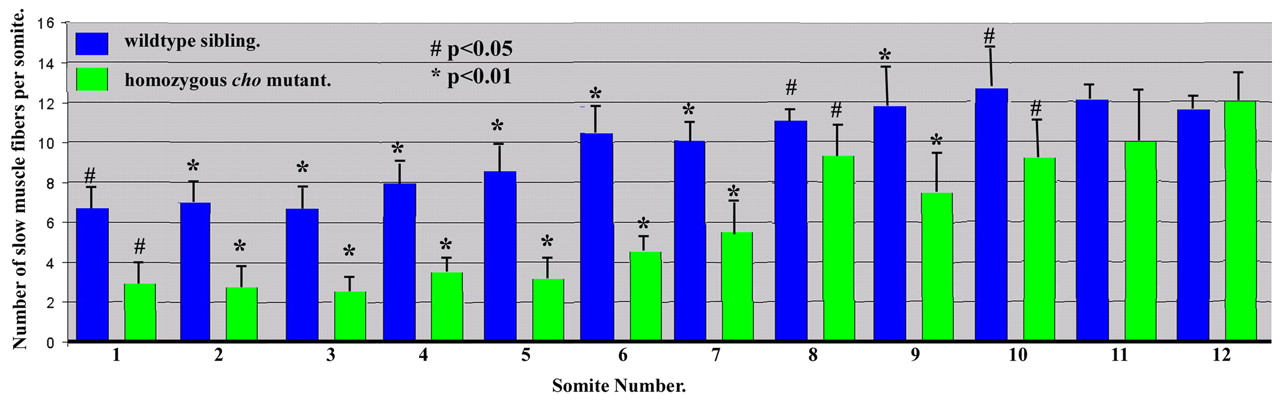
Fig. 5 Quantitation of slow muscle fibre numbers at different axial positions at 30 hpf. Student′s t-test P values for comparisons between cho and WT are indicated. Mean±s.d.; n=4.
Figure Data
Acknowledgments
This image is the copyrighted work of the attributed author or publisher, and
ZFIN has permission only to display this image to its users.
Additional permissions should be obtained from the applicable author or publisher of the image.
Full text @ Development