
|
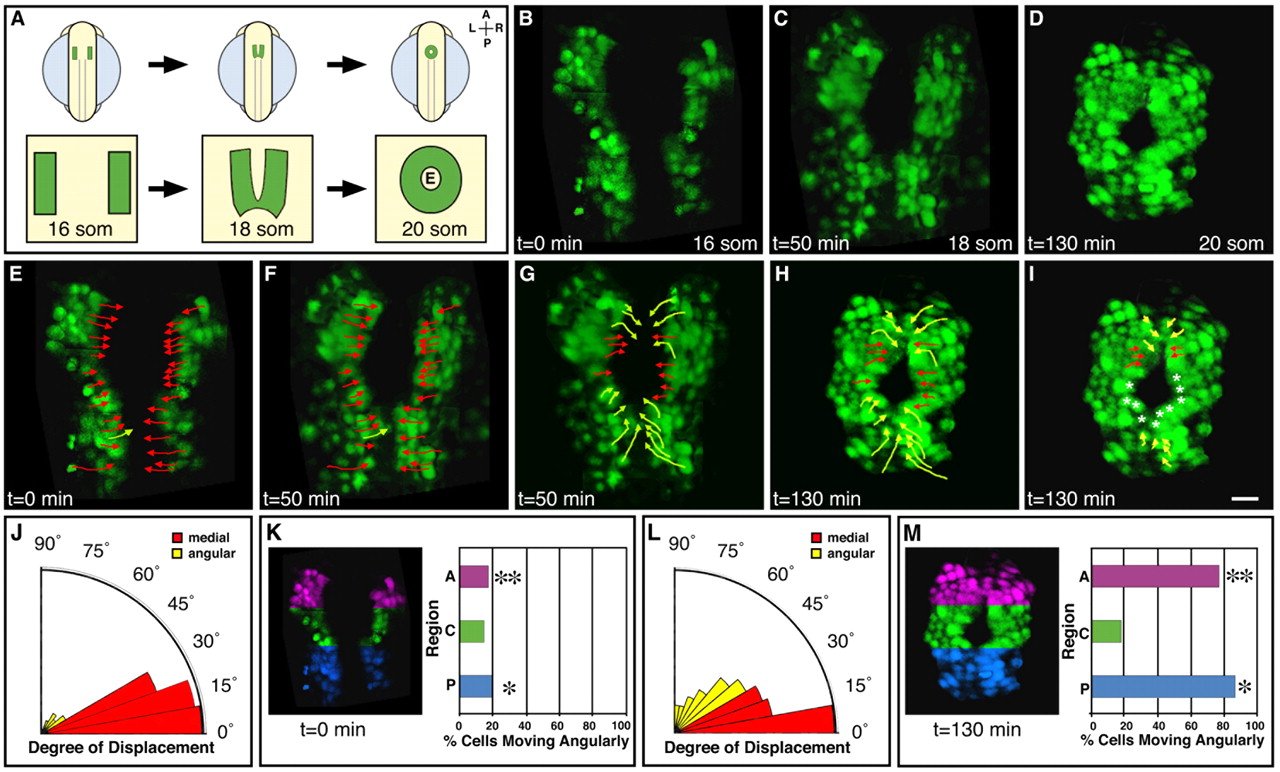
Fig. 1 Tracking wild-type cardiomyocytes reveals two morphologically distinct phases of cell behavior during cardiac fusion. (A) Schematic of cardiac fusion in the zebrafish embryo. Dorsal views; locations of cardiomyocyte populations shown in green; location of endocardium at the 20-somite stage indicated with an E. (B-D) Selected images from a time-lapse of cardiac fusion in a typical wild-type embryo expressing Tg(cmlc2:egfp) (see Movie 1 in the supplementary material), exhibiting cardiac morphology at the (B) 16-somite, (C) 18-somite and (D) 20-somite stages. Dorsal views, anterior to the top. (E-I) Paths traveled by individual cardiomyocytes during (E,F) the initial 50 minutes, (G,H) the final 80 minutes and (I) the final 20 minutes of fusion. Tracks displayed represent a subset of the tracked cells in this time-lapse. Each arrow extends from a cell's starting position to its ending position. Red arrows, medial movement; yellow arrows, angular movement; asterisks, cells exhibiting no net displacement over the elapsed time. Cardiac fusion begins with a phase of coherent medial movement (E,F), followed by a transition to angular movement in anterior and posterior regions (G,H). Scale bar: in I, 20 μm for B-I. (J-M) Quantitative analysis of the direction of cardiomyocyte movement. (J,L) Radial bar graphs depict degree of cardiomyocyte displacement during the first (J) and second (L) phases. For all tracked wild-type cardiomyocytes, net displacement along the anterior-posterior axis was calculated relative to a directly medial path (0° displacement). Grouping the data in 10° increments, the length of each radial bar reflects the percentage of cells exhibiting each degree of displacement. Red bars are classified as medial movement, and yellow bars are classified as angular movement. Significantly more cells exhibit angular movement during the second phase than during the first phase (52% versus 17%; t-test, P<0.01). (K,M) Location of cardiomyocytes moving angularly during first (K) and second (M) phases. Colors overlaid on egfp expression reflect anterior (purple), central (green) and posterior (blue) regions. Most of the cells exhibiting angular movement are located in anterior or posterior regions. In these regions, the percentage of cells moving angularly during the second phase is significantly greater than that observed during the first phase (*, posterior: 86% versus 20%; **, anterior: 77% versus 17%; t-test, P<0.01 for both regions). See Materials and methods for details of time-lapse analysis and Table 1 for additional data.