
|
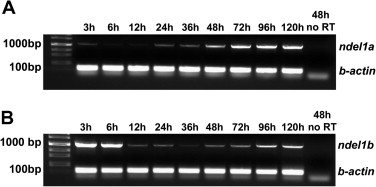
Fig. 2 RT-PCR analysis of ndel1a and ndel1b expression across development. ndel1a (A) and ndel1b (B) were amplified from an oligo dT primed cDNA library produced from 1 μg of total RNA at multiple stages ranging from 3 to 120 hpf. β-Actin serves as an internal control. (A) ndel1a is maternally expressed but levels dramatically decreased by 6 hpf. From 24 to 120 hpf, ndel1a expression gradually increases. In contrast, ndel1b (B) is highly expressed at 3 hpf but expression wanes to a low point at 36 hpf. Expression then gradually escalates to the last time-point tested at 120 hpf. The temporal distinction in expression was further validated by the results of the in situ hybridizations that follow.
Reprinted from Gene expression patterns : GEP, 7(6), Drerup, C.M., Ahlgren, S.C., and Morris, J.A., Expression profiles of ndel1a and ndel1b, two orthologs of the NudE-Like gene, in the zebrafish, 672-679, Copyright (2007) with permission from Elsevier. Full text @ Gene Expr. Patterns