
|
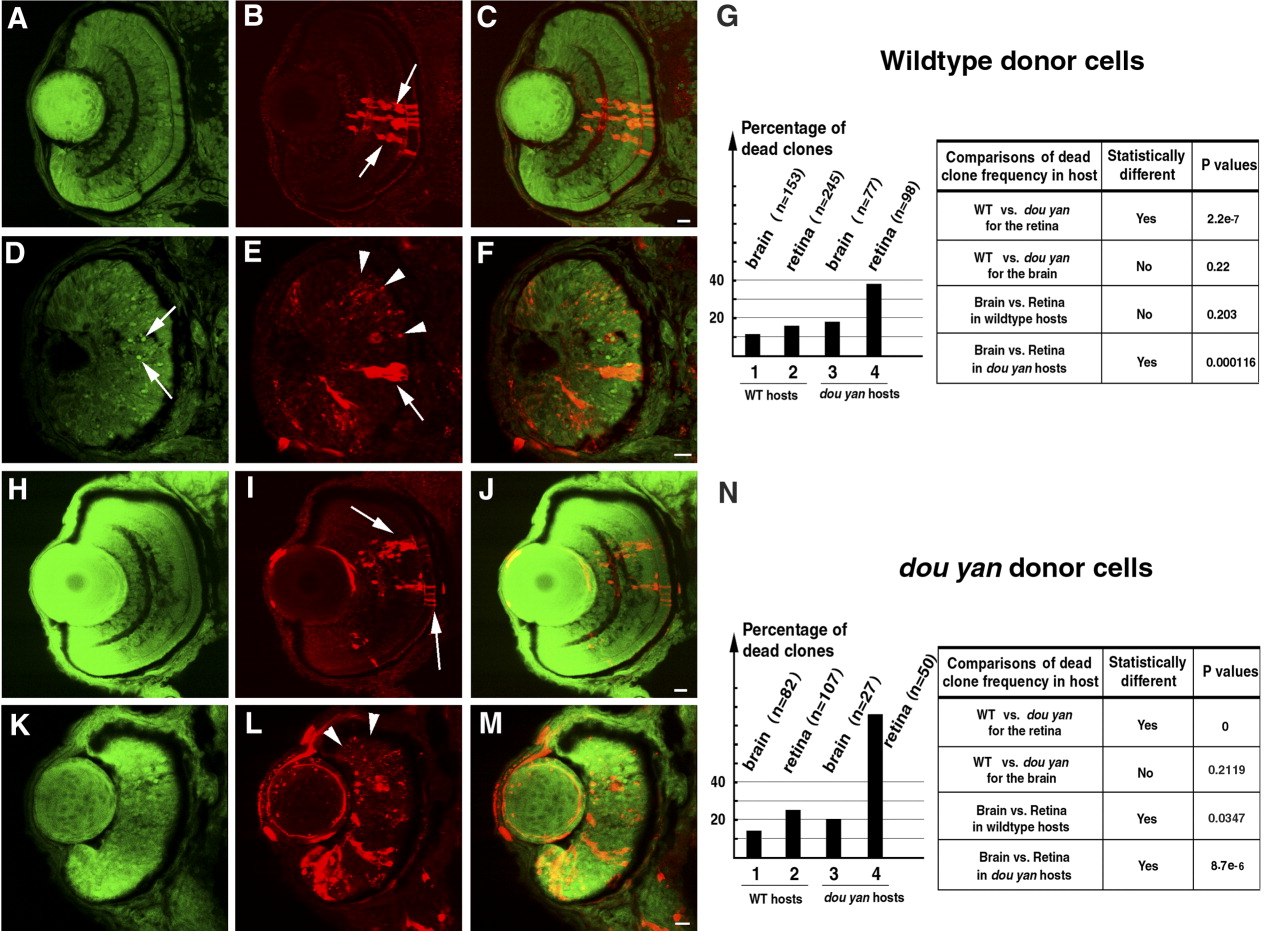
Fig. 5 The dou yanmi234 mutation causes non-cell-autonomous retinal cell death. A-C: Clones of dextran-labeled wild-type donor cells (red) in the wild-type retina form vertical columns of cells with a differentiated morphology that span all three retinal nuclear layers (arrows). The cell nuclei were stained with YO-PRO-1 (green); C is the merged image of A and B. D-F: Extensive punctate staining of donor cells (red, arrowheads in E) was observed in the mutant retinas, indicating that many wild-type donor cells were already dead at the time of fixation. Some donor cells appeared intact in the mutant retina, but they had an elongated morphology typical of undifferentiated retinal progenitors (E, arrow). Pyknotic nuclei heavily stained with YO-PRO-1 are indicated with arrows in D. G: A histogram illustrates the percentages of dead wild-type donor clones in four host conditions: in wild-type brains, in wild-type retinas, in mutant brains, and in mutant retinas. The total number of clones counted in each condition is indicated in parentheses. Comparison of the percentages of dead donor cell clones with the χ2 test indicates that the increase in dead wild-type donor clones in the mutant retina, but not the brain, is statistically significant. H-J: Healthy-appearing dou yan mutant donor cells (red, arrows) develop properly in the wild-type retina and can localize to all three retinal cellular layers. The cell nuclei are counterstained with YO-PRO-1 (green). K-M: Large amounts of punctate staining foci derived from mutant donor cells (arrowheads) were observed in mutant host retinas, indicating that many of the donor cells were already dead at the time of fixation. N: A histogram illustrates the percentages of dead clones of mutant donor cells in four host conditions: in wild-type brains, in wild-type retinas, in mutant brains, and in mutant retinas. The total numbers of clones counted in each condition are indicated in parentheses. Comparison of the percentages of dead donor cell clones with the χ2 test indicates that statistically more mutant donor cells survived in the wild-type retinas than in the mutant retinas at the time of examination. Scale bars = 10 μm.