
|
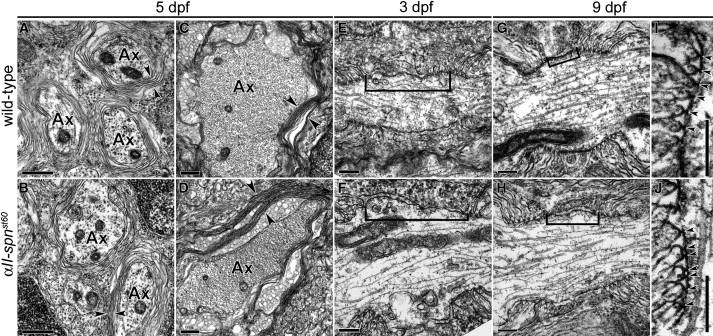
Fig. 4
Ultrastructural Analysis of the Node of Ranvier in αII-spectrinst60 Mutants
(A–D) TEM images of the PLLn (A and B) and Mauthner axons of the ventral spinal cord (C and D) in transverse sections of 5 dpf larvae. Arrowheads indicate multiple layers of myelin present in both the wild-type (A and C) and αII-spnst60 mutants ([B] and [D]; Ax = myelinated axon). For both the wild-type and mutants, the PLL nerves and spinal cords of at least six individuals were examined. Scale bars represent 0.5 μm.
(E and F) TEM images of nodes of Ranvier in longitudinal sections from the PLLn at 3 dpf. On average, the nodal gap between paranodes (indicated here with brackets) is slightly longer in αII-spnst60 mutants (F) than in the wild-type at this stage (E).
(G and H) Nodes of Ranvier from the PLLn at 9 dpf. At this stage, the average nodal gap in αII-spnst60 mutants (H) is significantly longer than that seen in wild-type nodes (G).
(I and J) Paranodes from longitudinal sections of the PLLn at 9 dpf. Morphology of the paranodal loops and transverse bands (indicated by arrowheads) are comparable between wild-type and mutant nodes. Scale bars for (E)–(J) represent 0.2 μm.