
|
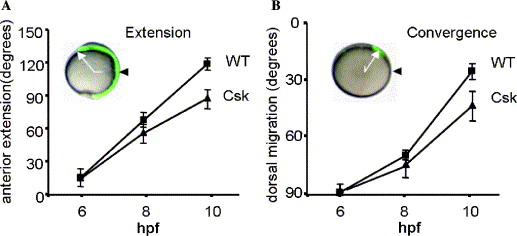
Fig. 3 CE cell movement defects in response to Csk knock down. (A) and (B) Embryos were loaded with caged fluorescein dextran and the fluorophore was uncaged at the shield stage (6 hpf) dorsally to determine anterior extension (A) or laterally to determine dorsal migration (B). Cell labelings of the same embryos were followed immediately after uncaging, at 80% epiboly, 8 hpf and at tailbud stage, 10–10.5 hpf. Wild-type and Csk-MO injected embryos were assessed. (A) Anterior extension (white arrow) from the site of uncaging (black arrowhead) was quantified at tailbud stage and is depicted as degrees anterior movement (inset is lateral view of a 10 hpf embryo, anterior at the top). (B) Dorsal migration (white arrow in inset) relative to the initial position at the shield stage (black arrowhead) was quantified at tailbud stage as degrees from dorsal (inset is a frontal view with dorsal to the top).
Reprinted from Mechanisms of Development, 124(2), Jopling, C., and den Hertog, J., Essential role for Csk upstream of Fyn and Yes in zebrafish gastrulation, 129-136, Copyright (2007) with permission from Elsevier. Full text @ Mech. Dev.