
|
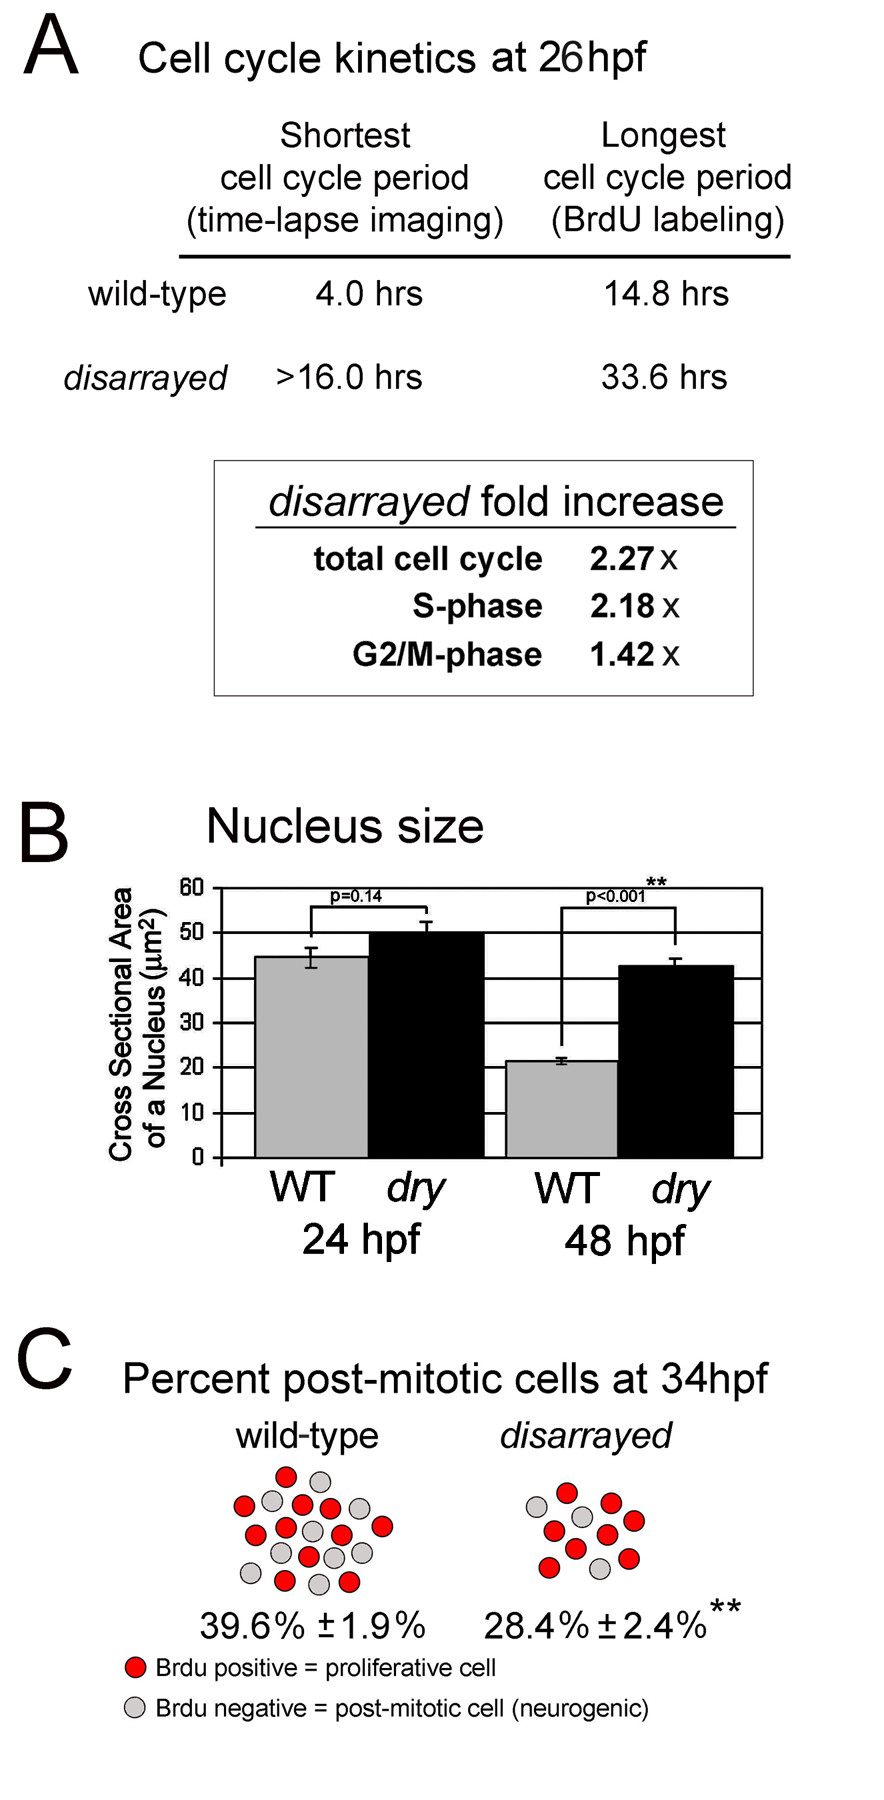
Fig. 5 Extended cell cycle and reduced rate of retinal neurogenesis in disarrayed. (A) Cell cycle kinetics at 26 hpf as determined using either direct time-laspse imaging or Cumulative BrdU Labeling with Labeled Mitosis methods. The total cell cycle period as well as S-phase and G2+M-phases were significantly extended at 28 hpf in disarrayed retinas, as indicated by fold increase compared to wild-type siblings. (B) Nucleus size in wild-type (WT, grey) or disarrayed (dry, black) retinal progenitors at 24 and 48 hpf. (C) Comparison of the proportion of proliferative cells (red) to total cells (red + grey) which exited that cell cycle from 28–34 hpf in wild-type and disarrayed embryos. In mutant eyes there are fewer total cells (216.2 +/- 8.4 vs. 383.1 +/- 15.0; n = 15 and n = 14 respectively) and a lower percentage that have exited the cell cycle by 34 hpf (average +/- SE, n = 18 (WT) and n = 11(dry)). ** p d 0.001 (Student′s t-test).