
|
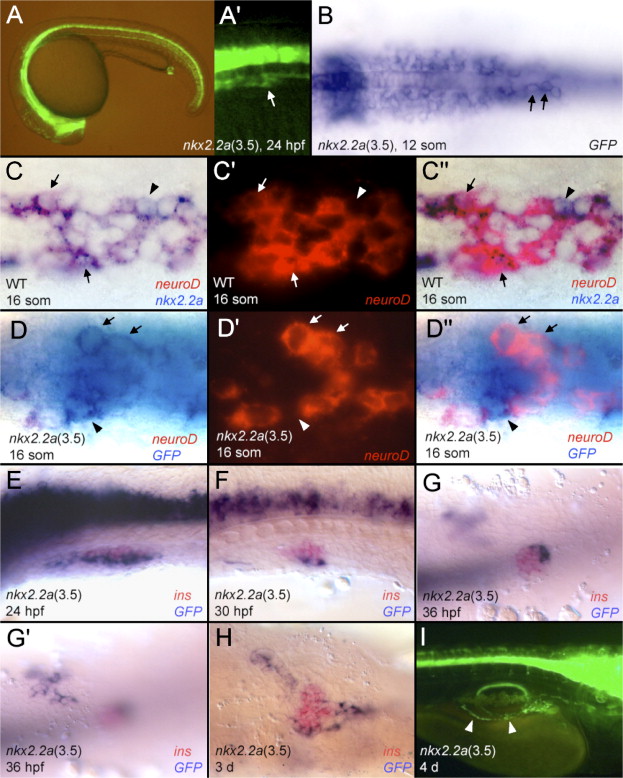
Fig. 3 GFP expression under the control of the 3.5 kb promoter fragment. (A, A′, I) GFP fluorescence. (B, D–H) GFP mRNA in blue. (C) nkx2.2a mRNA in blue. (C, D) neuroD mRNA in red. (E–H) insulin mRNA in red. (A, E, F, I) lateral views. (B–D, G, H) Ventral views. (A′) The pancreas of the same embryo shown in panel A at higher magnification (arrow). (B) GFP expression in the endoderm is indicated by arrows. (C, C′, C″) Same embryo, (C′) fluorescence of the neuroD probe, (C″) overlay of panels C and C′. (D, D′, D″) Same embryo, (D′) fluorescence of the neuroD probe, (D″) overlay of panels D and D′. (C, D) Cells labelled by nkx2.2a (C) or GFP (D) and neuroD are indicated by an arrow and cells expressing either nkx2.2a (C) or GFP (D) but not neuroD with an arrowhead. (E–G) Pancreatic islet showing reduction of GFP transcription. (G, G′) Two different focal planes of the same embryo, (G′) anterior pancreatic bud. (I) The pancreatic duct is highlighted by arrowheads, here the anterior is to the right.
Reprinted from Developmental Biology, 304(2), Pauls, S., Zecchin, E., Tiso, N., Bortolussi, M., and Argenton, F., Function and regulation of zebrafish nkx2.2a during development of pancreatic islet and ducts, 875-890, Copyright (2007) with permission from Elsevier. Full text @ Dev. Biol.