
Fig. 3
- ID
- ZDB-IMAGE-070418-40
- Publication
- Choi et al., 2007 - FoxH1 negatively modulates flk1 gene expression and vascular formation in zebrafish
- All Figures
- Figures for Choi et al., 2007
|
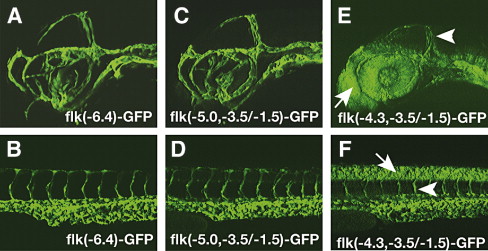
Fig. 3 Transgenic analysis of the flk1 regulatory region identifies a 1.5-kb minimal endothelial specific enhancer. (A–B) GFP expression patterns in the brain (A) and trunk (B) of 2-day-old TG(flk1:GFP)la116 embryos. (C–D) GFP expression patterns of 2-day-old embryos carrying germ line integrated flk(-5.0, -3.5/-1.5)-GFP transgene resembles the patterns observed in TG(flk1:GFP)la116. (E–F) Embryos carrying germ line integrated flk(-4.3, -3.5/-1.5)-GFP have GFP expression in endothelial cells (arrowhead) as well as neural tissues. Arrows point to GFP positive cells in forebrain in panel E and to GFP positive cells in neural tube in panel F.
Reprinted from Developmental Biology, 304(2), Choi, J., Dong, L., Ahn, J., Dao, D., Hammerschmidt, M., and Chen, J.N., FoxH1 negatively modulates flk1 gene expression and vascular formation in zebrafish, 735-744, Copyright (2007) with permission from Elsevier. Full text @ Dev. Biol.