
|
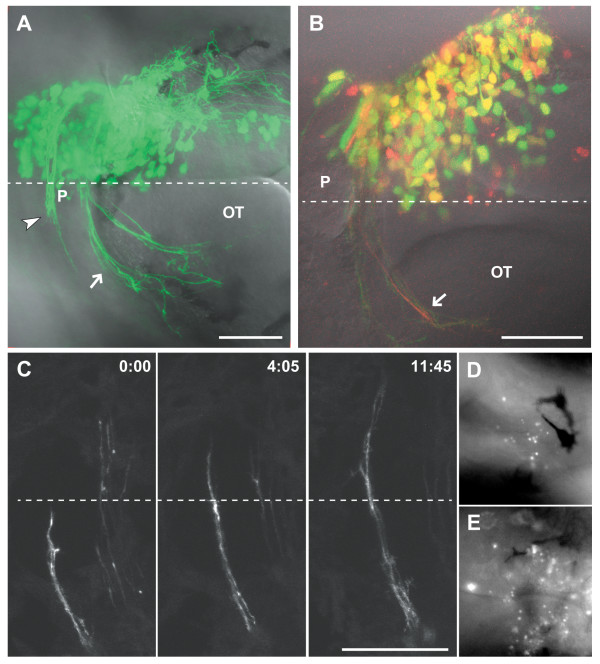
Fig. 2 Results of electroporation at 2 dpf. (a) A 2 dpf embryo after electroporation at 24 hpf with 0.7 mg/ml each pHuC:GAL4/pUAS:EGFP. Axons of the developing habenular (arrowhead) and posterior (arrow) commissures are visible. (b) A 2 dpf embryo electroporated with 0.5 mg/ml each pHuC:GAL4/pUAS:EGFP/pUAS:mCherry. The mCherry channel (red) is less well resolved compared to EGFP (green) due to suboptimal excitation with a 543 nm laser line. Approximately 60% of cells express both transgenes at high levels (yellow). (c) Time series of commissural axons in the habenular commissure. Images were collected at room temperature, and growth cone migration is slower than normal. (d,e) Acridine orange staining two hours after electroporation shows higher levels of scattered cell death bilaterally in the brains of electroporated embryos (e) compared to unelectroporated siblings (d). Dorsal views, anterior to the left. Dashed lines indicate the midline. Time is hours:minutes. Scale bars = 50 μm. OT, optic tecum; P, pineal organ.