
|
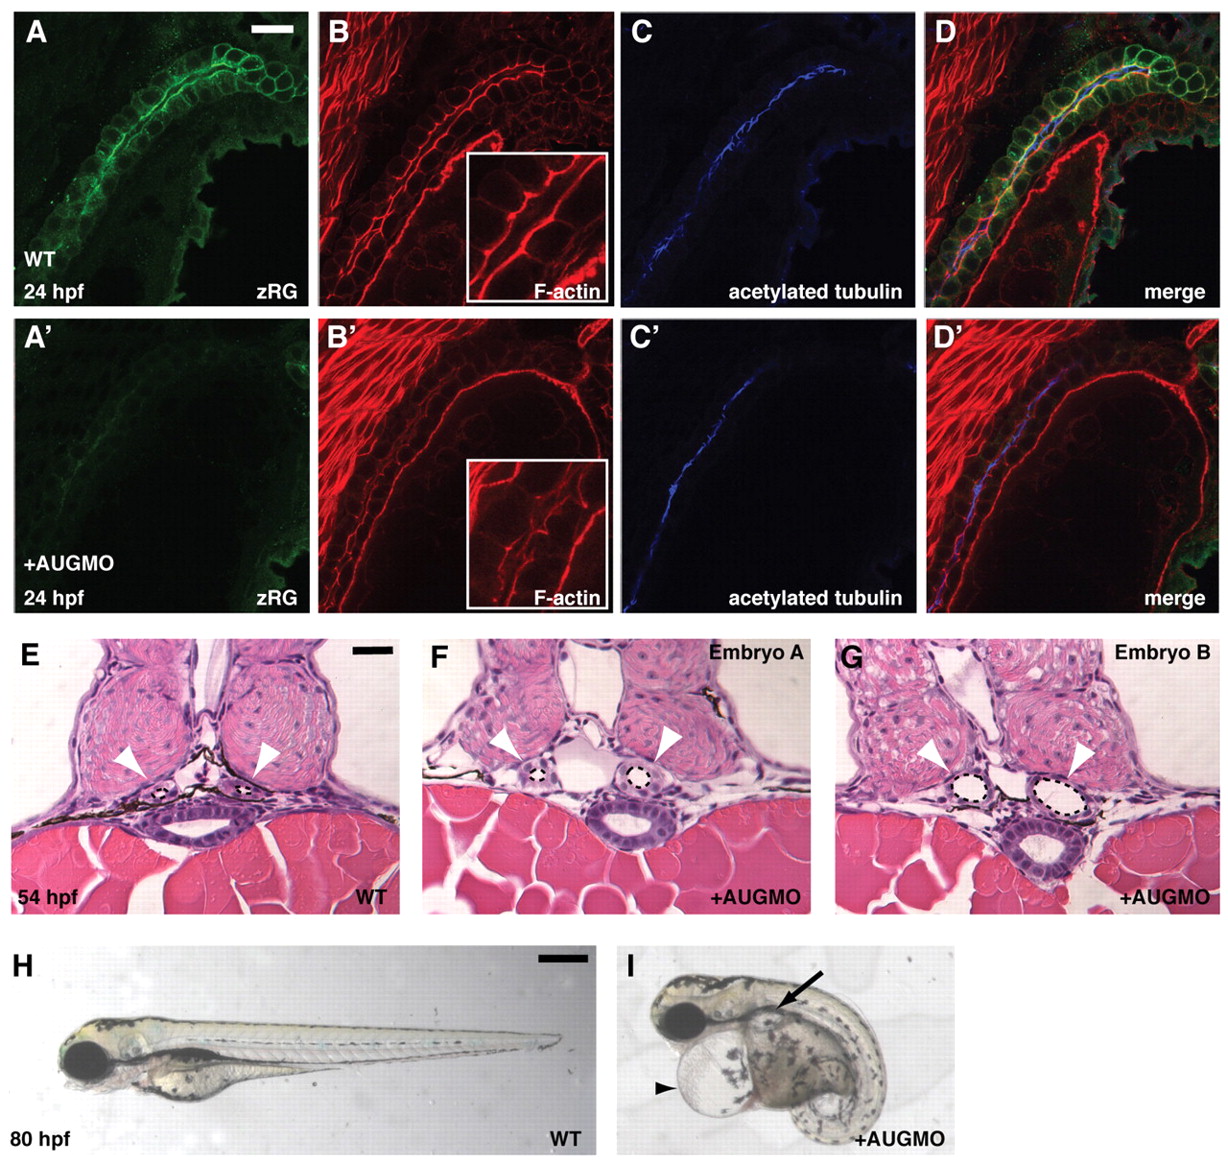
Fig. 6 Loss of Arhgef11 function leads to formation of pronephric cysts. (A-D′) Fluorescent immunostaining of 24 hpf WT control and MOAUG-injected embryos to visualize zRG (green), F-actin (red) with magnified view inset, and acetylated tubulin (blue). Scale bar, 20 μm. (E-G) JB-4 sections of 54 hpf WT control embryos (E) compared with sections from two embryos injected with 4 ng MOAUG (F,G) at the same stage. Pronephric ducts are indicated by white arrowheads, and their lumens are outlined by dotted lines. Scale bar, 25 μm. (H,I) Live embryos at 80 hpf showing an uninjected WT embryo (H) compared with WT injected with 4 ng MOAUG (I), which exhibits cardiac edema (arrowhead) and pronephric cysts (arrow). Scale bar: 300 μm.