
|
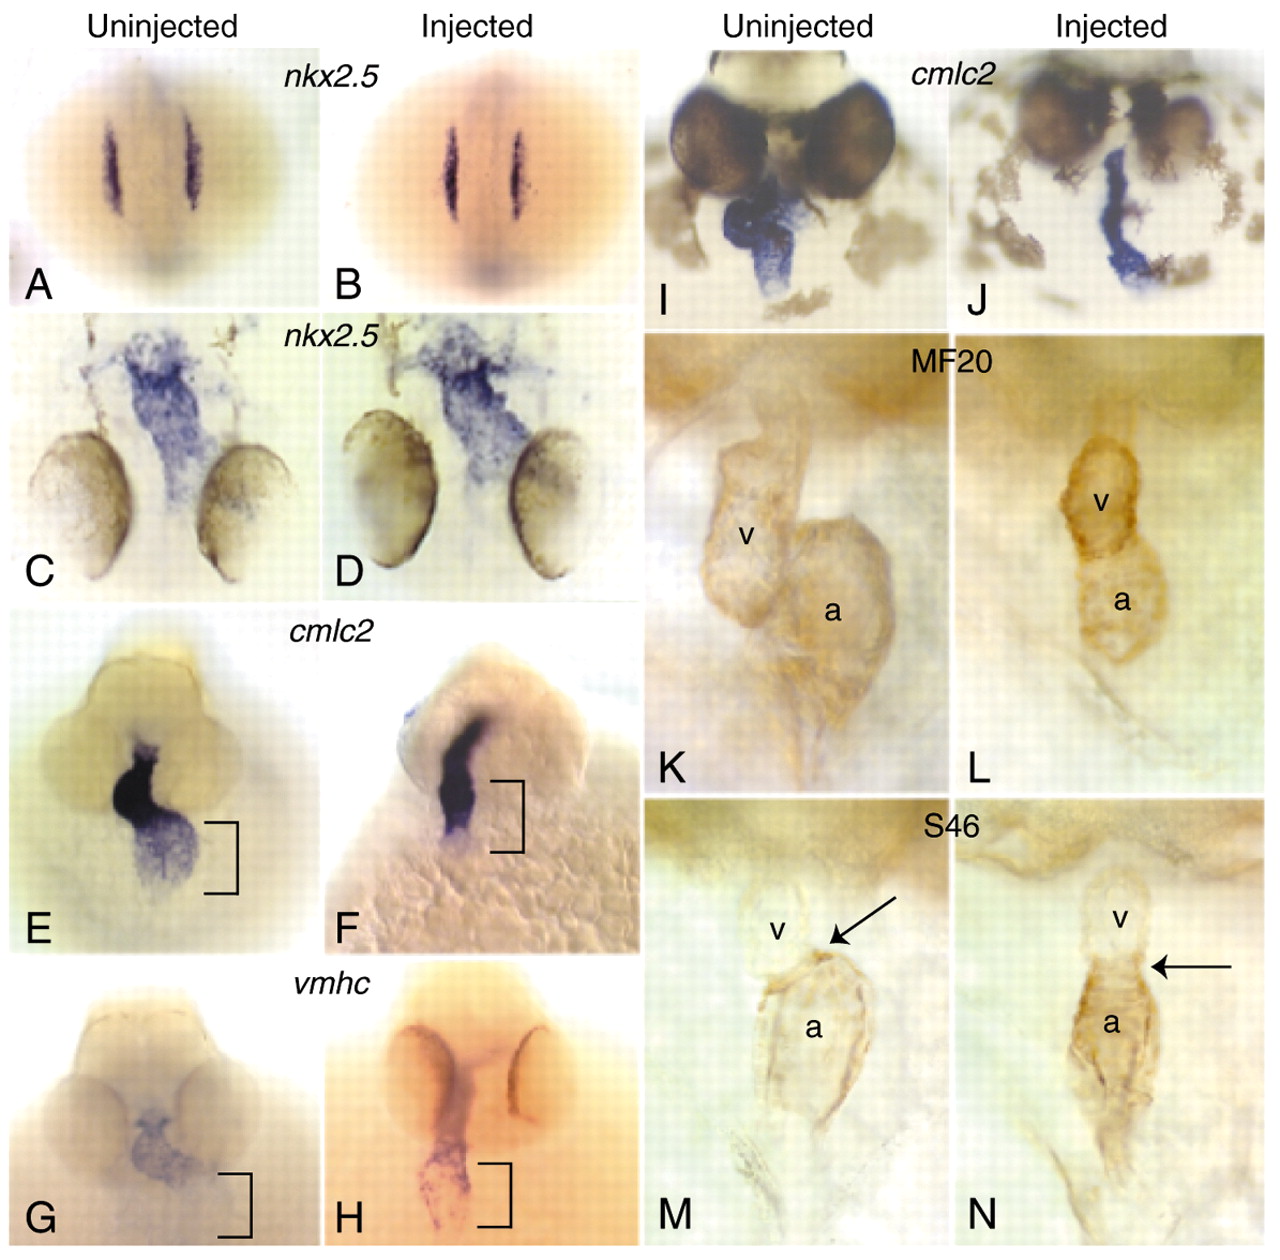
Fig. 2 In situ and immunohistological analysis of cardiogenesis in the hrT morphants. (A-D) Dorsal views with anterior at the bottom. (A,B) Expression of nkx2.5 in uninjected (A) and hrTMO(1)-injected (B) embryos at the 12-somite stage in bilateral stripes. (C,D) Expression of nkx2.5 in the linear cardiac tube of uninjected (C) and hrTMO(1)-injected (D) embryos at 24 hpf. (E-N) Frontal views with anterior towards the top. (E,F) Cardiac expression pattern of cmlc2 in uninjected (E) and hrTMO(1)-injected (F) embryos at 33 hpf. Black bracket indicates the atrial region. (G,H) Cardiac expression patterns of vmhc in uninjected (G) and hrTMO(1)-injected (H) embryos at 33 hpf. Black bracket marks the atrial region. (I,J) Expression of cmlc2 in uninjected (I) and hrTMO(1)-injected (J) embryos at 36 hpf when cardiac looping is taking place. The injected embryo (J) has defective looping. (K,L) MF20 antibody stains the atrium and ventricle of uninjected (K) and hrTMO(1)-injected (L) embryos at 48 hpf. (M,N) S46 antibody stains the atrium of uninjected (M) and hrTMO(1)-injected (N) embryos at 48 hpf. Black arrows indicate the atrioventricular boundary. (a, atrium; v, ventricle). Injected embryos were injected with 1.5 ng of hrTMO(1).