
|
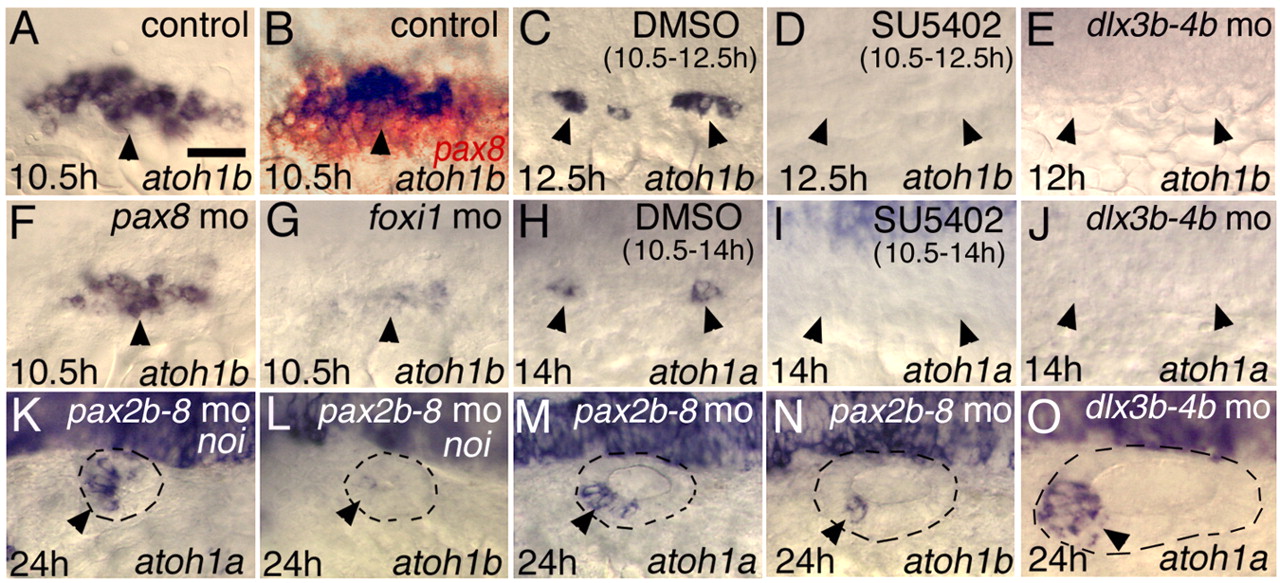
Fig. 7 Inducers of early atoh1 expression. (A,B,F,G) Expression of atoh1b at 10.5 hpf in a control embryo (A,B), pax8 morphant (F) and foxi1 morphant (G). The specimen in B was double stained to reveal pax8 expression (red). (C,D) Expression of atoh1b at 12.5 hpf in embryos treated from 10.5-12.5 hpf with DMSO alone (C) or SU5402 in DMSO (D). (H,I) Expression of atoh1a at 14 hpf in embryos treated from 10.5-14 hpf with DMSO alone (H) or SU5402 in DMSO (I). (E,J,O) dlx3b;dlx4b morphants showing expression of atoh1b at 12 hpf (E) or atoh1a at 14 hpf (J) or 24h hpf (O). (K-N) Expression at 24 hpf of atoh1a (K,M) and atoh1b (L,N) in noi mutants injected with pax2b-pax8 MO (K,L), and in wild-type embryos injected with pax2b-pax8 MO (M,N). All are dorsolateral views with anterior to the left. Arrowheads indicate observed or expected domains of otic expression. Scale bar: 30 μm in A,B,F,G,K-O; 10 μm in C-E,H-J.