
|
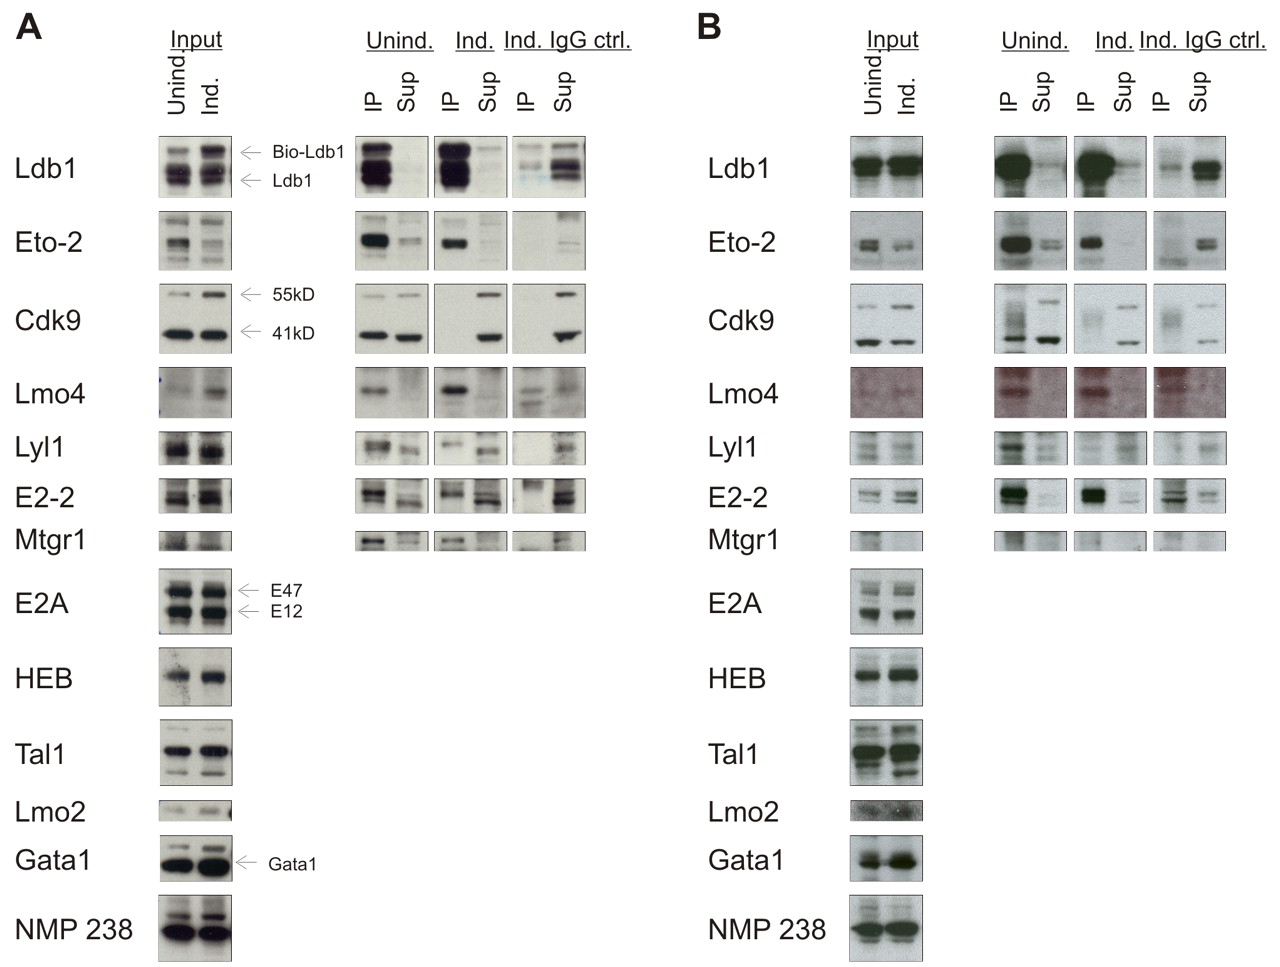
Fig. 2 Analysis of Ldb1 interacting protein complexes. Protein levels of Eto-2, Cdk9 and Lmo4 change with induction of C88 cell differentiation. Western blot analysis of noninduced (Unind.) and induced (Ind.) C88 cells containing bio-Ldb1 (A) or untransfected C88 cell nuclear extracts (B). Input lanes indicate levels of tested proteins in untreated nuclear extracts diluted to the same concentration as in the immunoprecipitation experiments. Proteins immunoprecipitating with Ldb1 (IP lane) and supernatant (Sup) are shown and labelled accordingly. The isoforms of bio-Ldb1, Cdk9 and E2A, are indicated.